Post analytics in Ghost admin gives you easy access to track your audience’s engagement with the content you publish, letting you see what’s resonating (and what’s not) with your readers.
To help you get the most out of post analytics, here’s an overview of the data that Ghost collects and displays.
Post list
Your Post list can be viewed by clicking Posts in your sidebar. In addition to allowing you to edit posts, this screen gives you a quick overview of how each published post is performing across web and email.
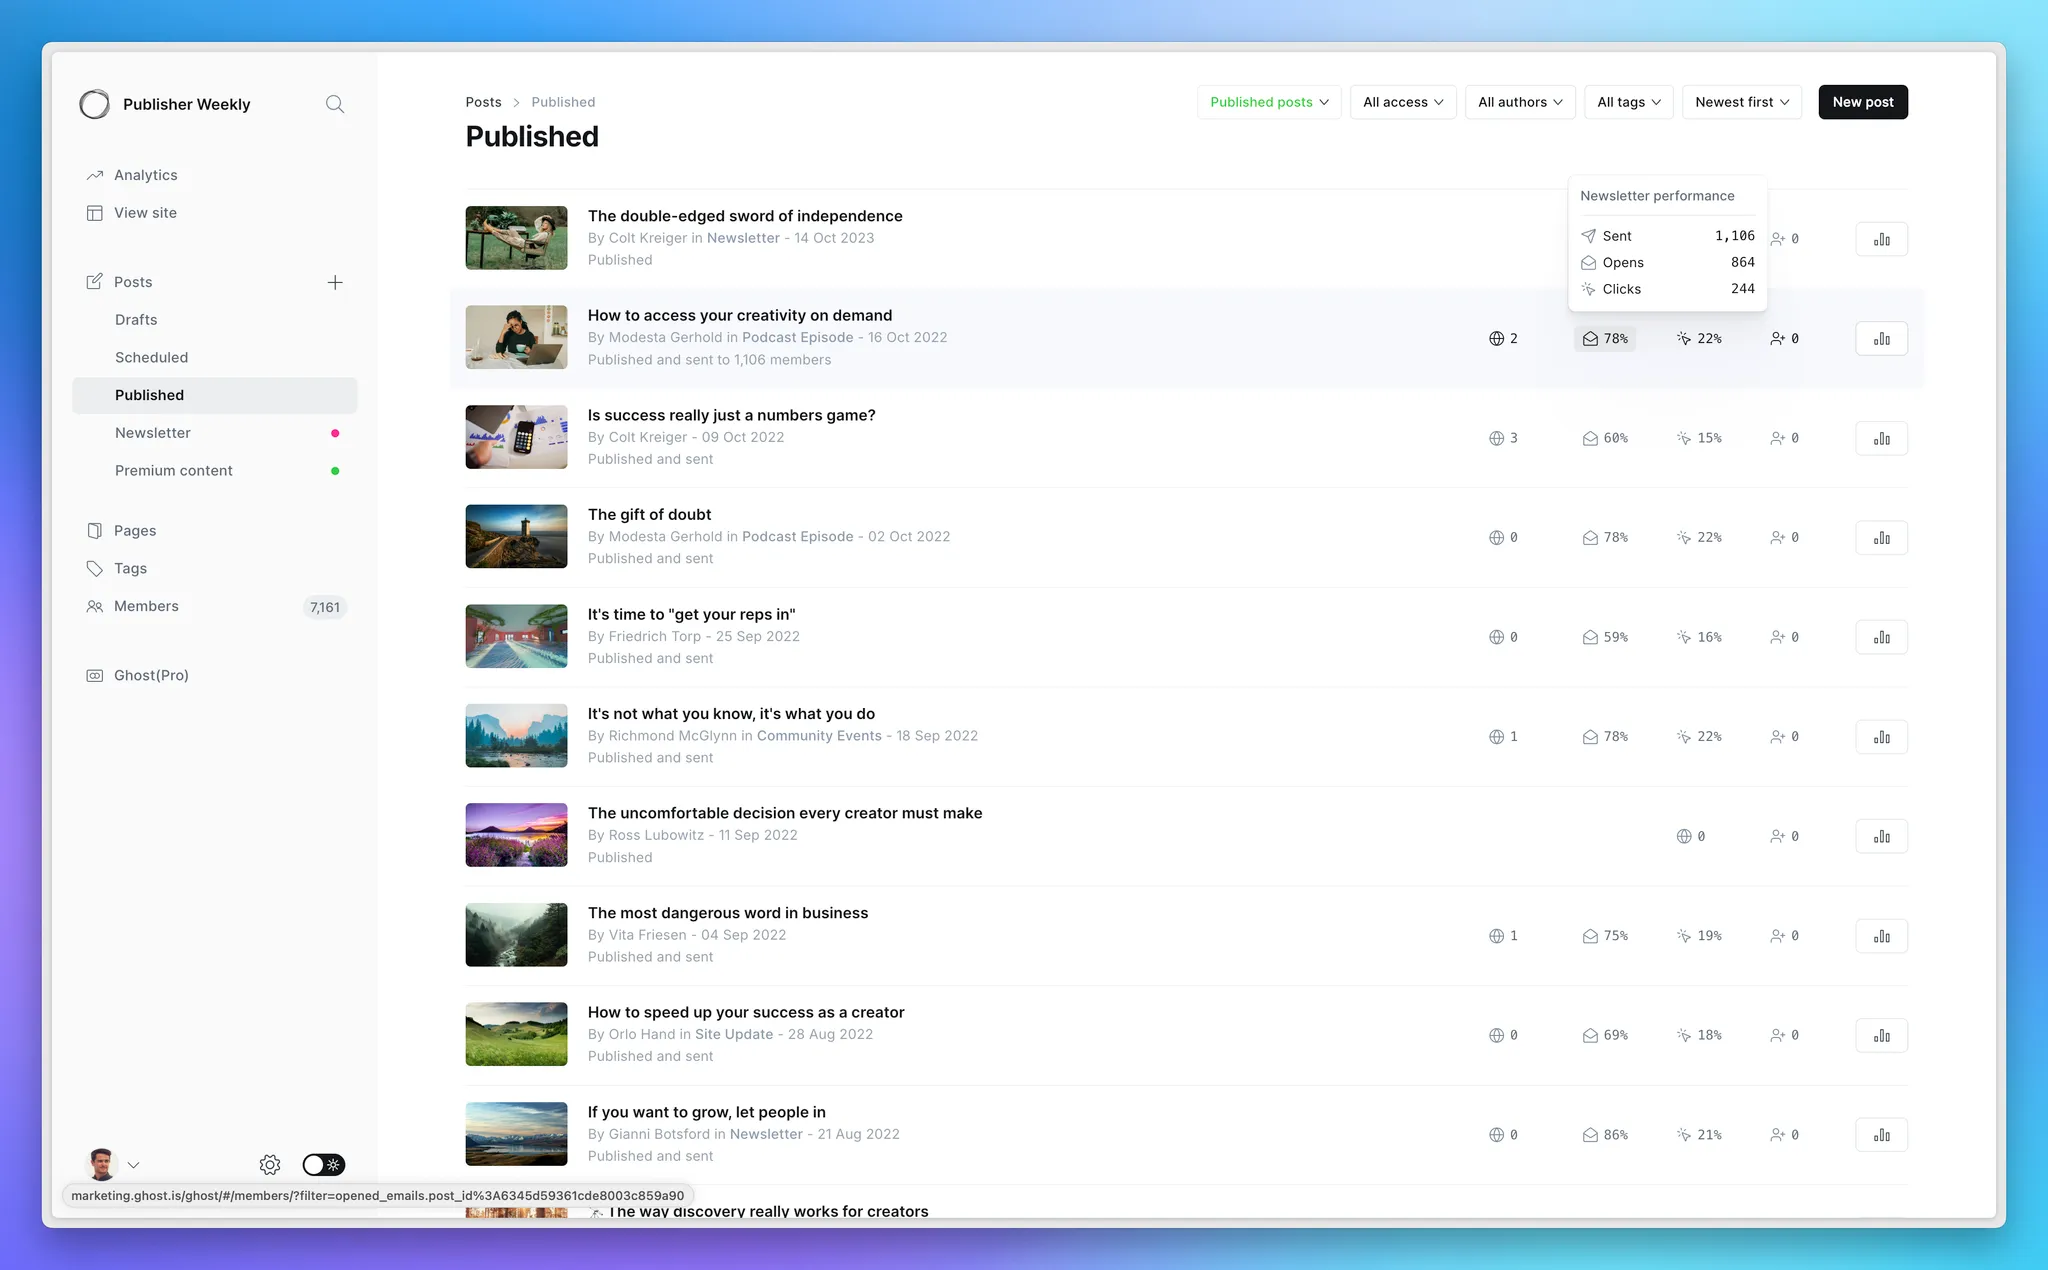
For each published post, you’ll see:
- Unique visitors → The number of people that viewed this post on your site.
- Opens → The number of unique members that opened your newsletter. The open rate (shown as a percentage) is the number of opens divided by the number of recipients.
- Clicks → The number of unique members who clicked a link in your newsletter. The click rate is calculated as clicks divided by recipients.
- Members → The number of people who signed up — or purchased a paid subscription (if enabled) — immediately after viewing this post.
To dig further into each post’s individual performance, click the graph icon on the far right.
Overview
The Overview tab gives you a snapshot of how an individual post is performing — across web, email, and membership growth. It surfaces the most important metrics at-a-glance, including traffic, engagement, and conversions.
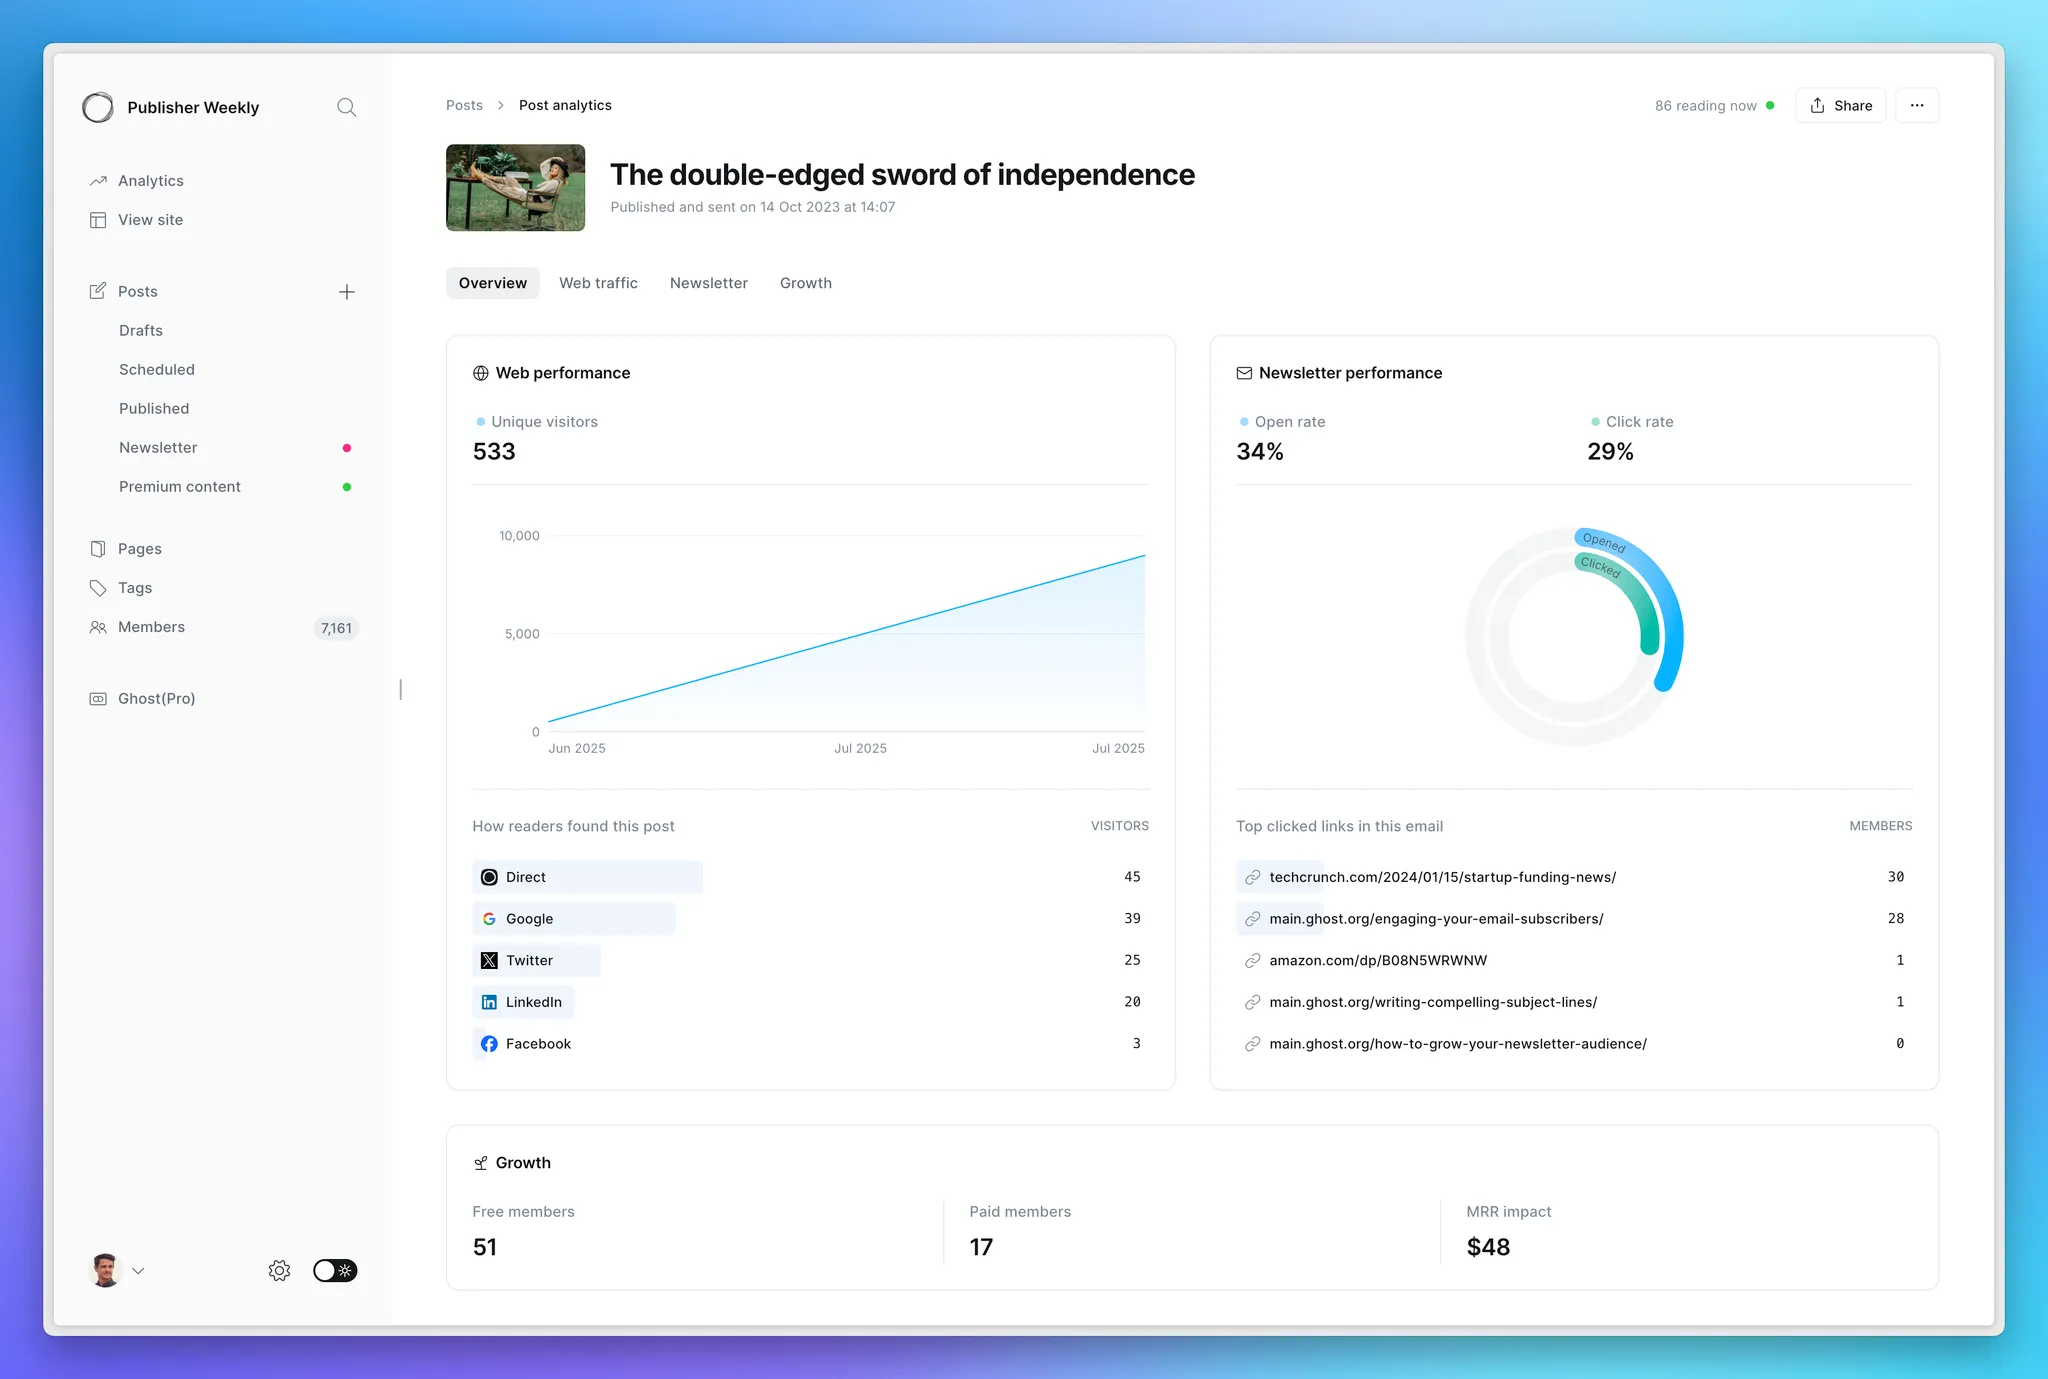
From here, you can dive deeper into each area by clicking into specific sections, or by exploring the tabs across the top: Web traffic, Newsletter, and Growth.
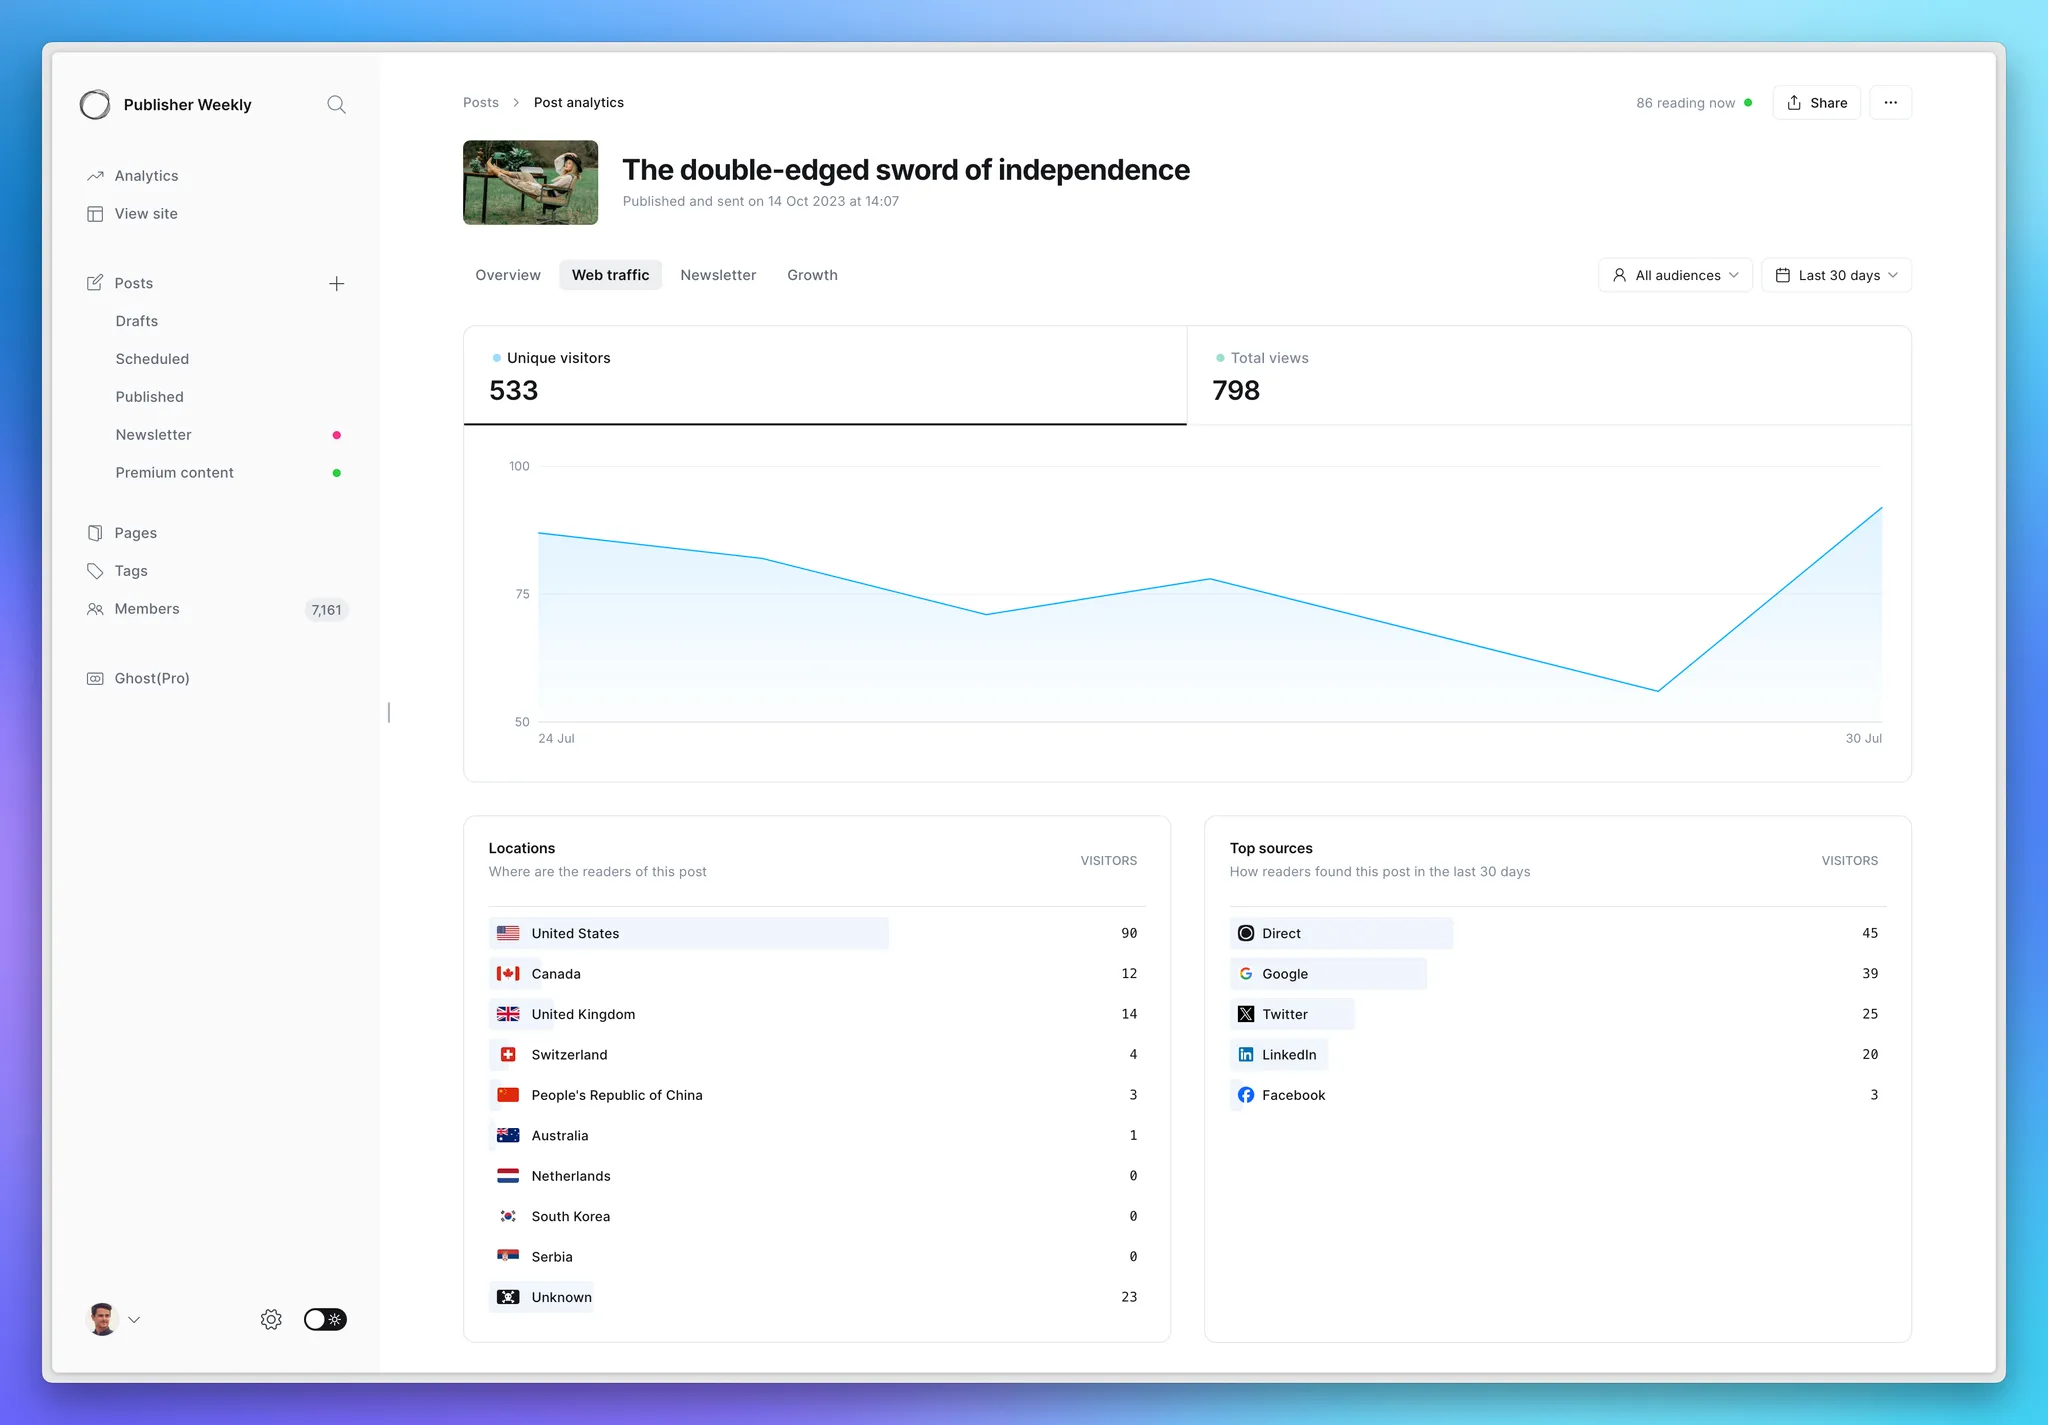
Web traffic
The Web traffic tab shows how many people viewed the specific post on your site, and where that traffic came from.
Traffic metrics
At the top of the tab, you'll see:
- Unique visitors — The number of distinct people who viewed this post on your site.
- Total views — The total number of times the post was viewed, including repeat visits.
Below the chart, you’ll also see:
- Locations — A breakdown of which countries your readers came from.
- Top sources — How visitors found the post, such as direct visits, social media, or referral links.
Filter by date range or audience
In the top right corner, you’ll find filters that can be applied to the entire tab:
- Date range — The default view is the past 30 days, and can be adjusted ranging from today to all time.
- Audience segment — See what’s resonating across different segments of your readers: Public visitors, Free members, and Paid members.
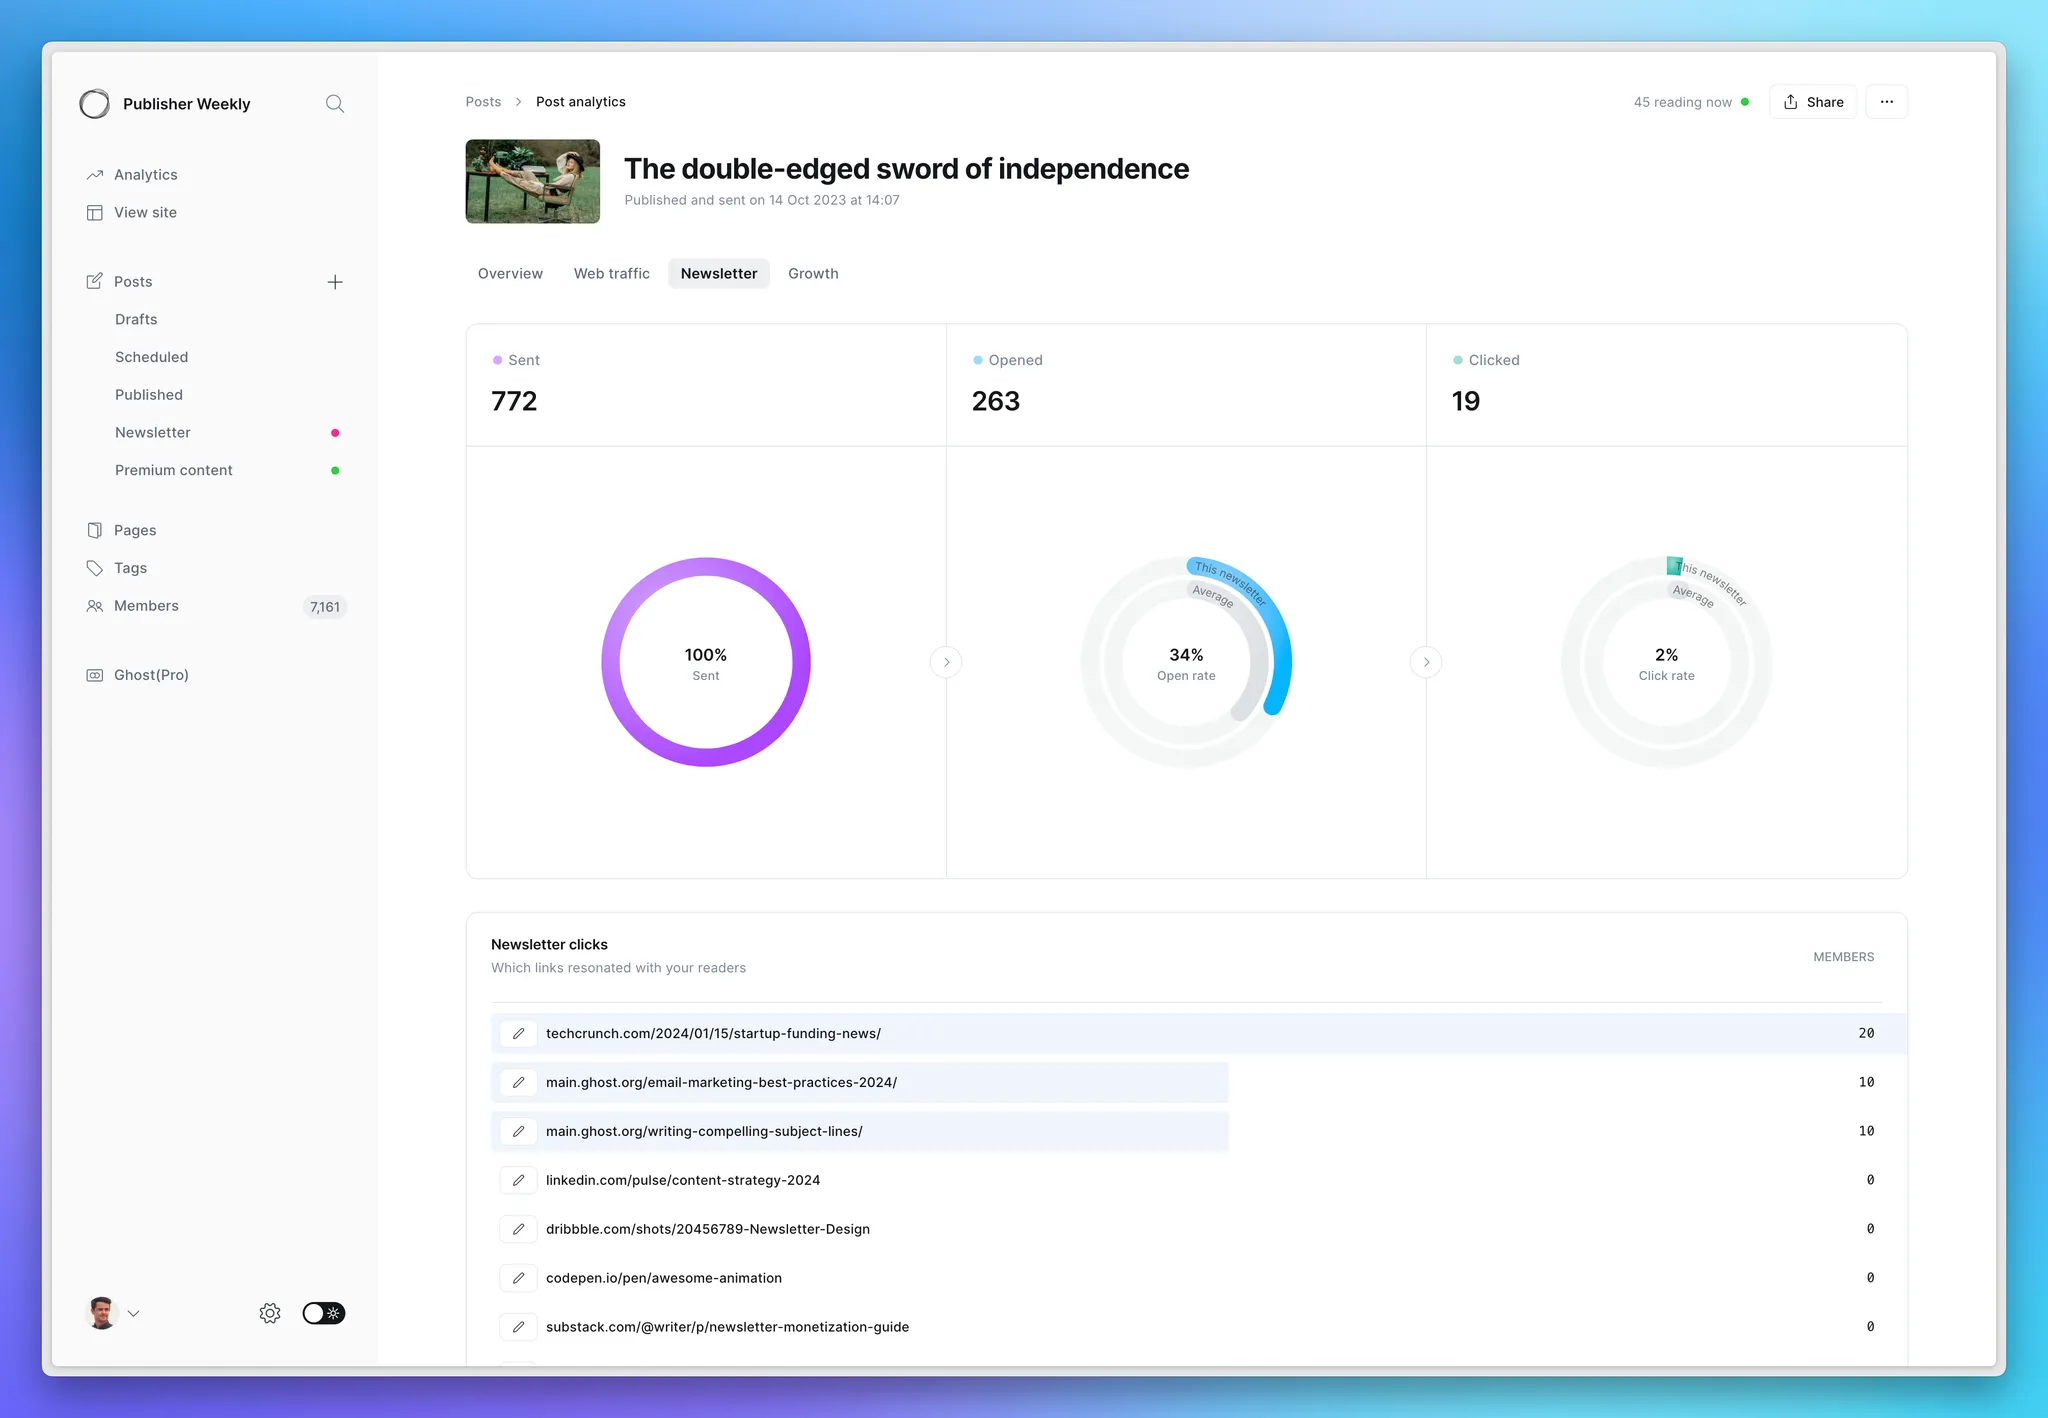
Newsletter
When a post is sent via email, the Newsletter tab gives you a detailed breakdown of how readers engaged with your content in their inbox.
Newsletter stats
At the top of the tab, you’ll see:
- Sent — The number of members who were sent your newsletter.
- Opens → The number of unique members that opened your newsletter. The open rate (shown as a percentage) is the number of opens divided by the number of recipients.
- Clicks → The number of unique members who clicked a link in your newsletter. The click rate is calculated as clicks divided by recipients.
To help you contextualize how a specific post performed, open and click rates are compared against your typical averages — based on the last 20 newsletters you've sent.
Audience Feedback
A breakdown of the feedback your members provided — either “More like this” or “Less like this” — when reading your newsletter.
Learn how to enable audience feedback in your newsletters.
Newsletter clicks
Here you’ll see which links in your newsletter got the most engagement. Each link is listed with the number of unique members who clicked it.
If you need to fix or update a link after the newsletter has been sent (we’ve all been there!), you can edit links in newsletters — even after it’s landed in someone’s inbox.
Growth
The Growth tab shows how many new members signed up as a direct result of the post — and how much revenue it generated, if you have paid memberships enabled.
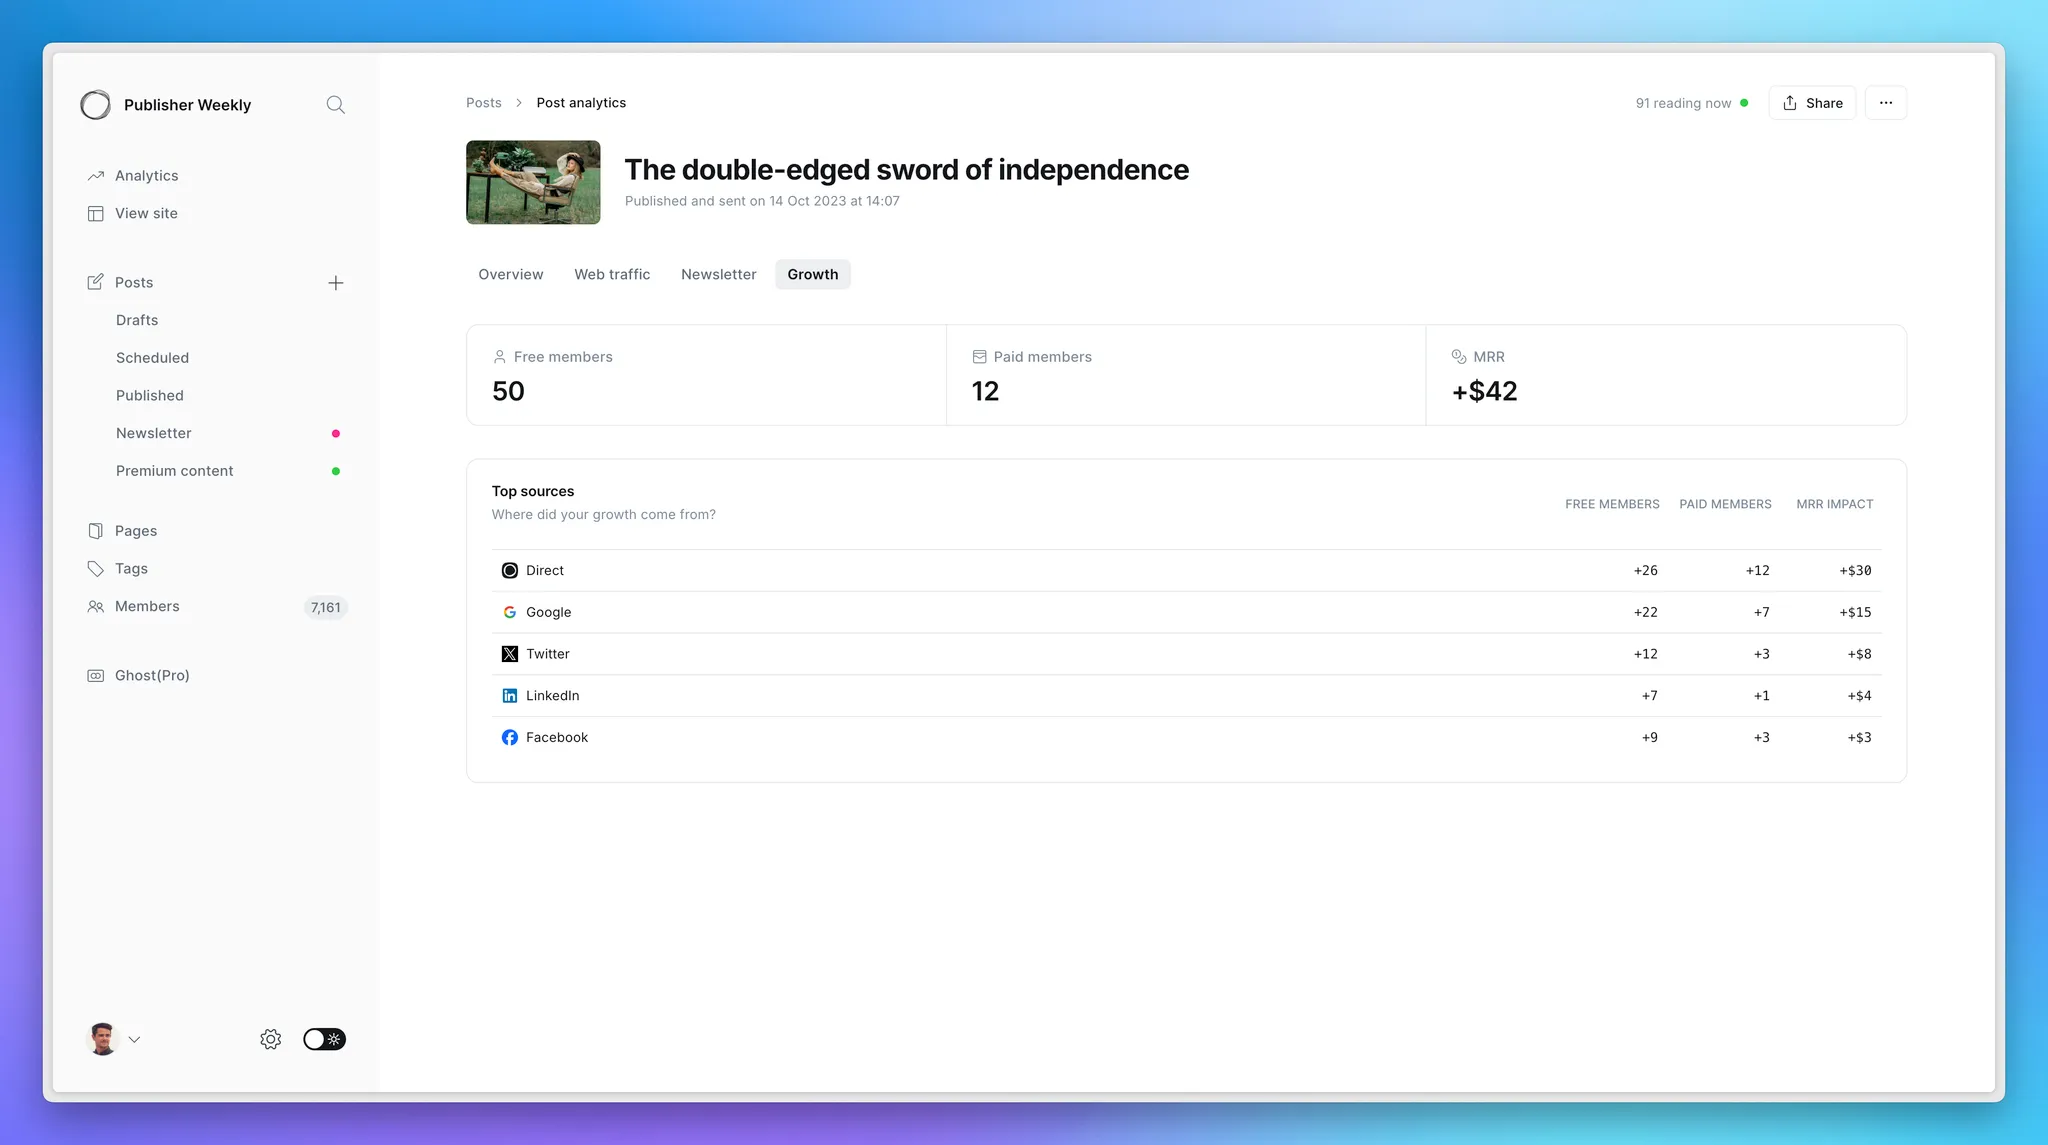
At the top of the tab, you’ll see:
- Free members — The number of people who signed up for a free membership after reading this post.
- Paid members — The number of people who started a paid subscription after viewing this post.
- MRR impact — The amount of Monthly Recurring Revenue attributed to those paid signups.
Below that, the Top sources section breaks down where those signups came from — showing which referrer or link drove the conversion, along with whether those members were free or paid and the MRR impact of each source. Learn more about setting your own custom source.
Exporting post analytics
Sometimes you just want all the data — we get it 🤓. To export analytics for your last 1,000 posts, head to Settings → Import/Export in Ghost Admin and click Export post analytics.
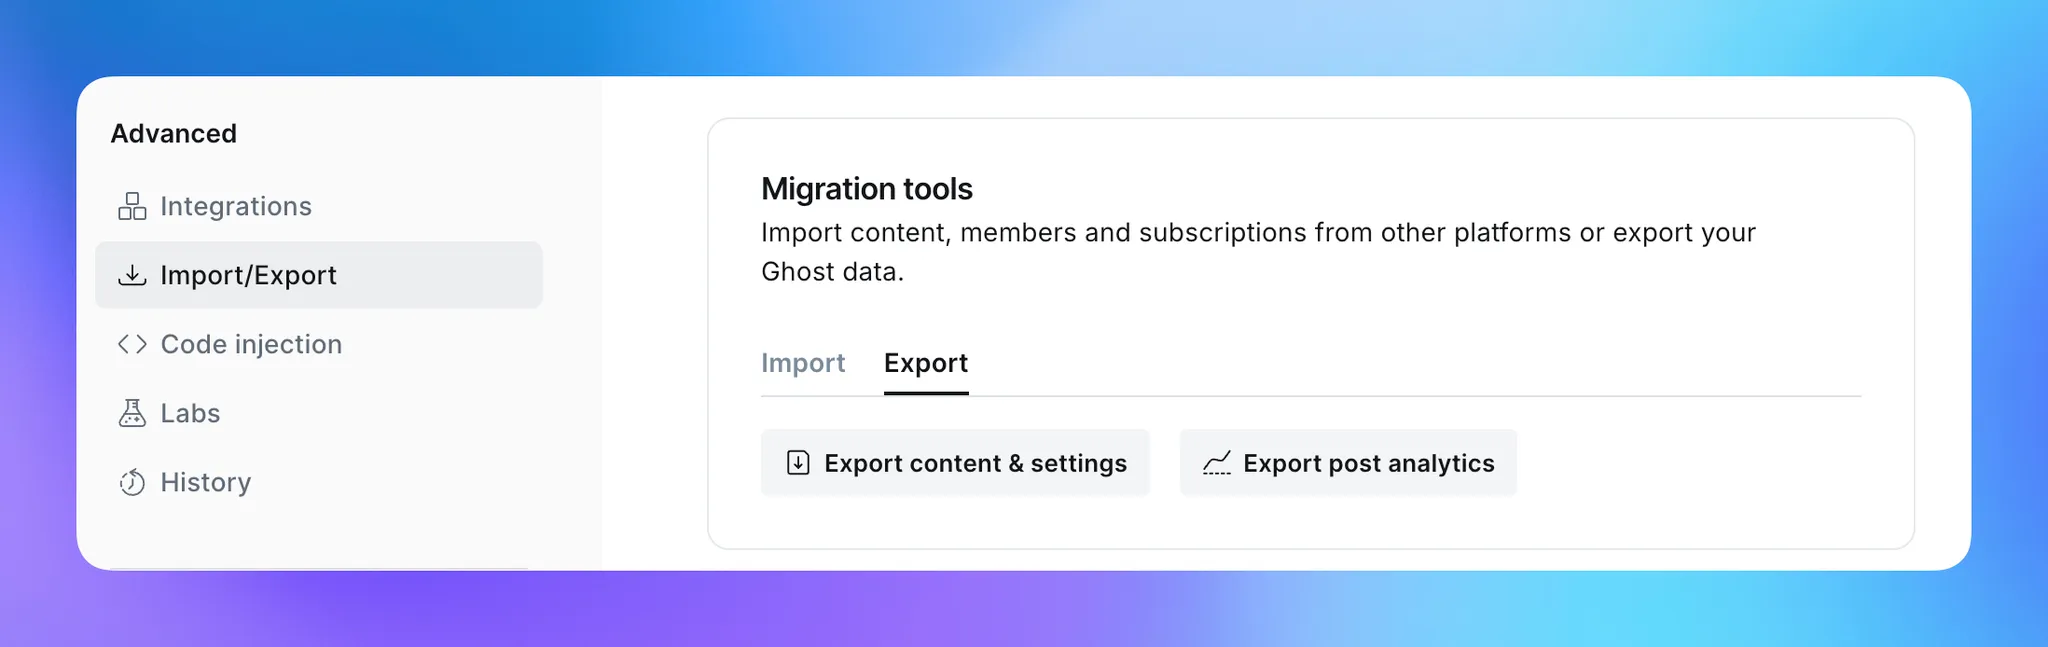
This will download a CSV file containing all your metrics, so you can dig into the data using the tool of your choice.
The CSV file contains the following metrics:
| Data | Description |
|---|---|
| ID | Each post's unique identifier in Ghost |
| Post title | The full title of each post |
| URL | The full URL of each post |
| Author | Comma separated for multiple authors |
| Status | Published, published and sent, email-only |
| Created date | The date the post was first created |
| Last updated date | The date the post was last updated |
| Published date | The date the post was published |
| Featured | True/false |
| Tags | Comma separated, including internal tags |
| Post access | Public, members-only, paid members-only, etc... |
| Email recipients | Free members, paid members, labels, etc... |
| Newsletter name | Shown if multiple newsletters are setup |
| Sends | How many people the post was delivered to |
| Opens | How many members opened the email |
| Clicks | How many members clicked the email |
| Free Signups | How many free signups the post generated |
| Paid conversions | How many paid subscriptions the post generated |
| Feedback: more like this | Available when using audience feedback |
| Feedback: less like this |
Available when using audience feedback |