Web analytics explained: What creators & publishers need to know
A simple introduction to the metrics that matter.
Web analytics are useful for content creators and newsletter writers because they offer a strong signal on what’s going on and the impact your efforts have on the world. They help you understand which posts bring in readers, what topics people enjoy most, and even how people discover your content in the first place.
The stats will motivate you to keep publishing the content people enjoy while guiding you to create a better website experience for an even larger number of readers. For publishers new to web analytics, here are the most important metrics, what they mean, and how to think about them.
Is your website growing?
The first area web analytics can help you measure is your growth rate, which is one of the most important areas overall. How many people are visiting your website? What do your growth trends look like over the last week, month, or year? Is your website traffic going up, down, or is it stagnant?
Unique visitors
Unique visitors is a top-level indicator of what’s happening. It shows you the number of people who have visited your site in a particular time period. This number is different than page views because a single visitor can, and most likely will, view several different pages during a single visit.
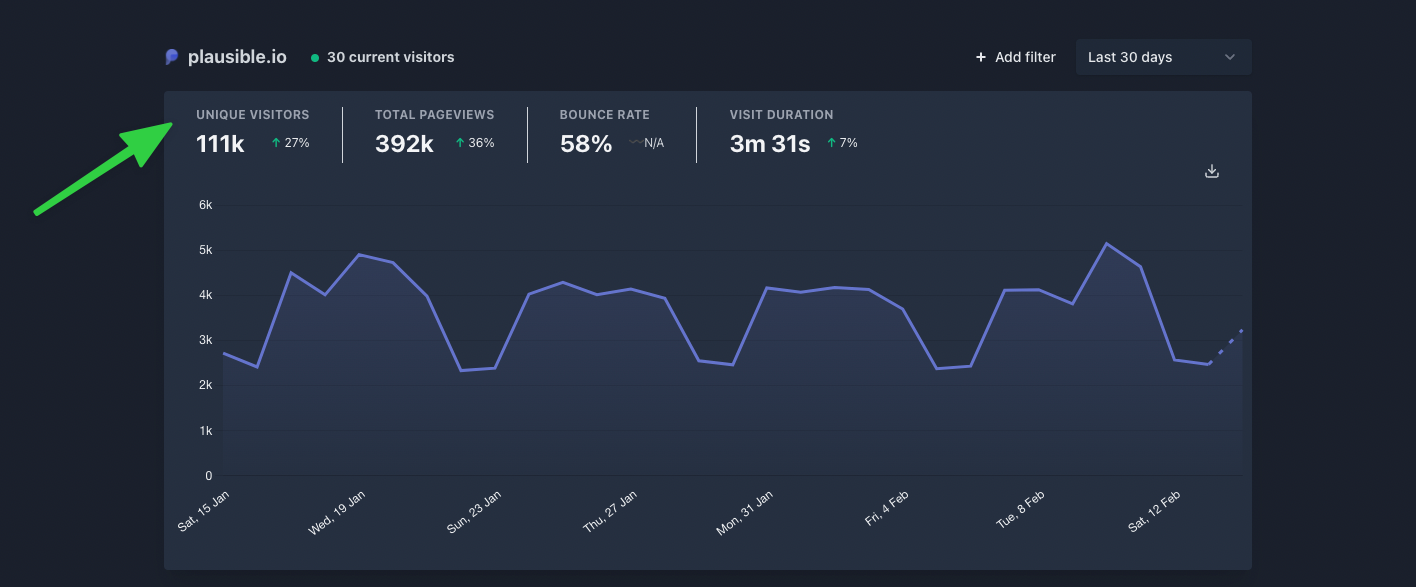
This metric is important because it offers a high-level view of your website’s traffic. If you’re consistently growing this number, it means more people are discovering your content.
The simplest way to see if your site is growing is to compare the number of unique visitors for two time periods, such as this month versus the previous month.
Now, sometimes these comparisons won’t be so simple. If you have a large spike of traffic because one of your posts goes viral on Twitter, it’s only natural that you will see a big drop in visitors in the following period. Accept that short-term traffic fluctuations are normal and wait for more long-term trends to emerge before making any drastic decisions.
How do people discover your content?
Understanding how people discover your content is key when you want to analyze your marketing campaigns and other growth activities. Good analytics tools will help you see exactly where your readers are coming from.
Referral sources
You can see all referral sources that are sending you traffic. A source is reported when a person clicks through to your site from another site.
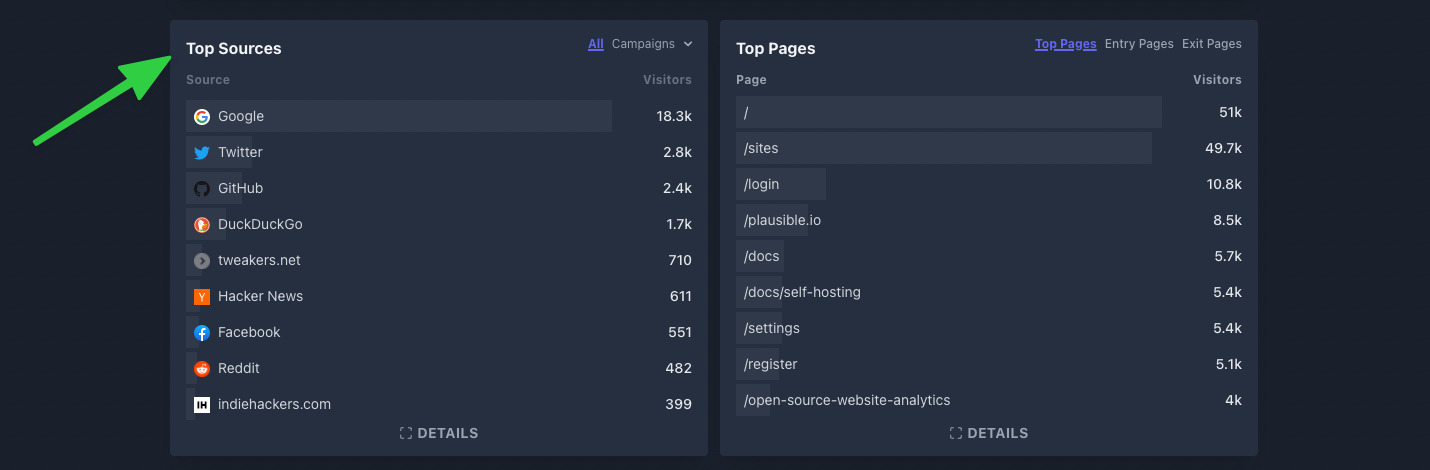
Referral sources can help you understand the effectiveness of your actions. For example, if you’re spending a lot of time and energy on TikTok, but see that most of your traffic is coming from Twitter, that information can help you adjust your priorities.
In a broad sense, identifying your most successful referral sources will help you understand the types of communication and marketing activities that are best for your audience. Oftentimes, just a small change in strategy can lead to big results once it’s directed correctly.
UTM parameters and how to uncover the “dark” traffic
UTM parameters are short text codes that you add to URLs to help you track the performance-specific campaigns. They’re useful because they help you get more insights into your growth and marketing activities.
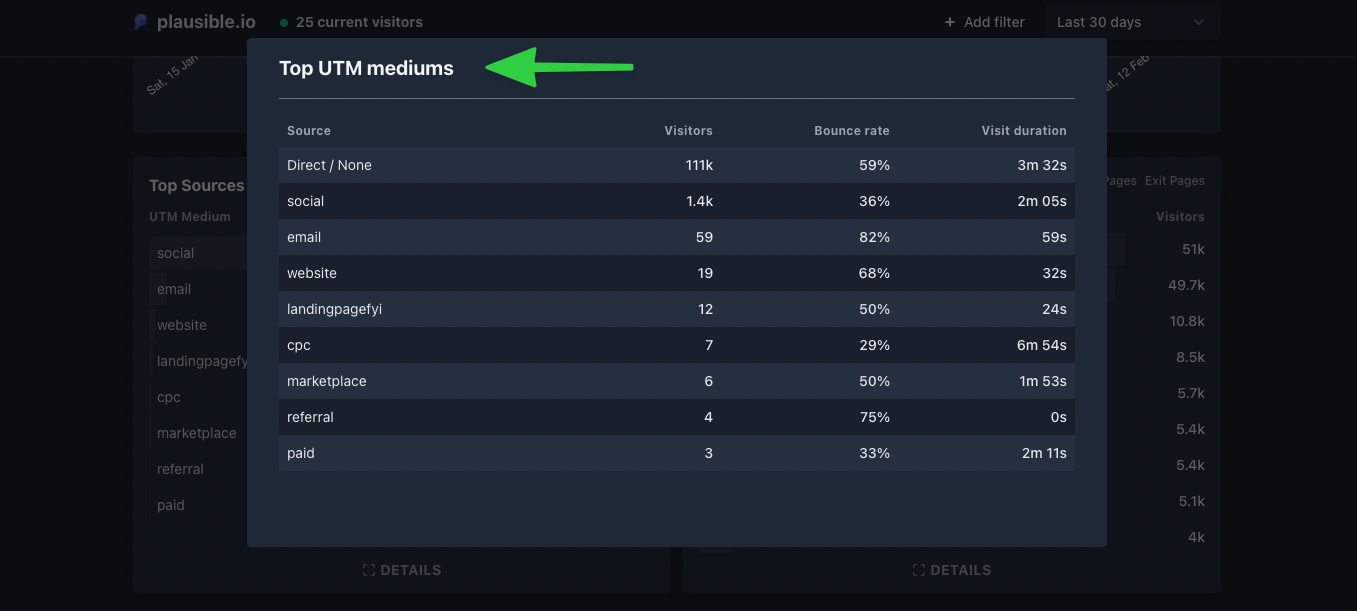
A lot of website traffic doesn’t have a referrer header (which tells you where they came from). This traffic is called dark traffic.
Dark traffic includes clicks from emails, documents, mobile messengers, bookmarks, people typing in the URL directly into the browser, and many other mechanisms. Site owners cannot see which referrer sources are sending that traffic and it’s classified as “direct / none” in web analytics.
UTM tags are a perfect tool to remedy this by allowing you to gather more insights from your email marketing and social media campaigns.
A solution to minimize dark traffic is to tag links. Here’s what a link looks like when it’s tagged with UTM parameters:
‘yourdomain.com?utm_medium=social&utm_source=Twitter&utm_campaign=milestone’
UTM parameters are all the tags that come after the question mark (?) in the URL above:
utm_medium=emailutm_source=Newsletterutm_campaign=black+friday+discount
Individual parameters are separated by the ampersand (&) symbol. Any links that you include in emails should be tagged. At the top level, you can use ‘utm_source=email’ to see how many visitors you’re getting from emails.
But you can go even further. For instance, you could track clicks on the link you have placed in your personal email signature:
‘?utm_medium=email&utm_source=personal&utm_campaign=signature’
Or you could track individual newsletter that you send out to your subscribers:
‘?utm_medium=email&utm_source=my-newsletter&utm_campaign=january-edition’
What are people doing when they visit your website?
This next metric tells you more about the different areas, sections, and pages of your site. You’ve put a lot of time and effort to create those pages and web analytics can tell you which of them are attracting visitors. Metrics such as page views, bounce rate, and visit duration can show you which of your pages are more useful than others. This can help you better allocate your future time and efforts to do more of the things that work and that your audience is interested in.
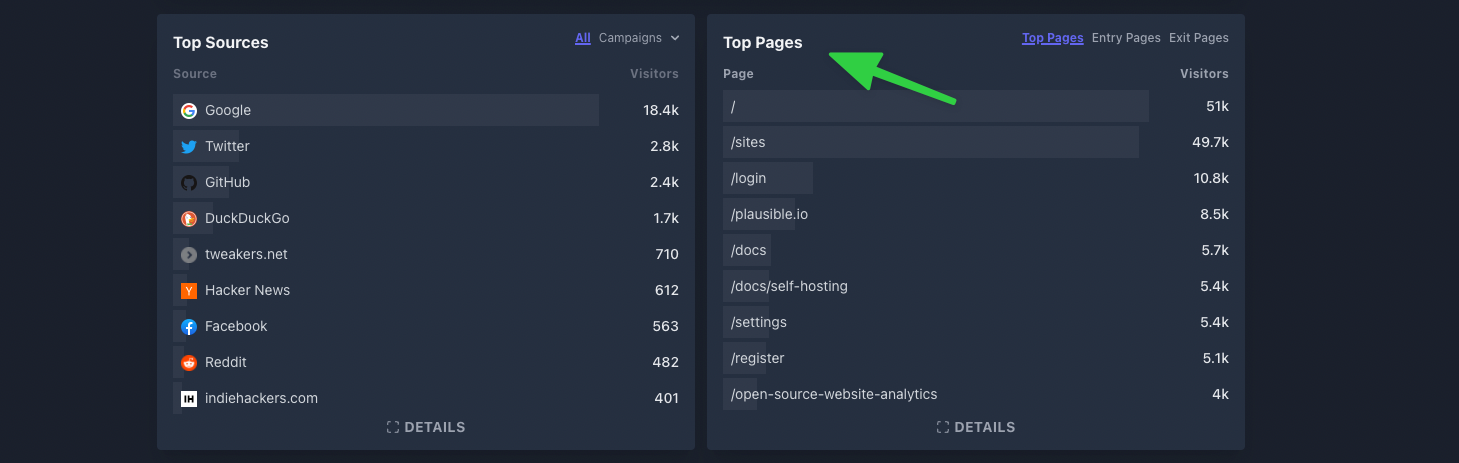
Top pages
This data point showcases the top-performing pages on your website. For most sites, these usually include items like a homepage, about page, and popular articles.
Bounce rate and visit duration
Bounce rate and visit duration can give you a deeper level of insight when compared to page views and will help you uncover more useful information.
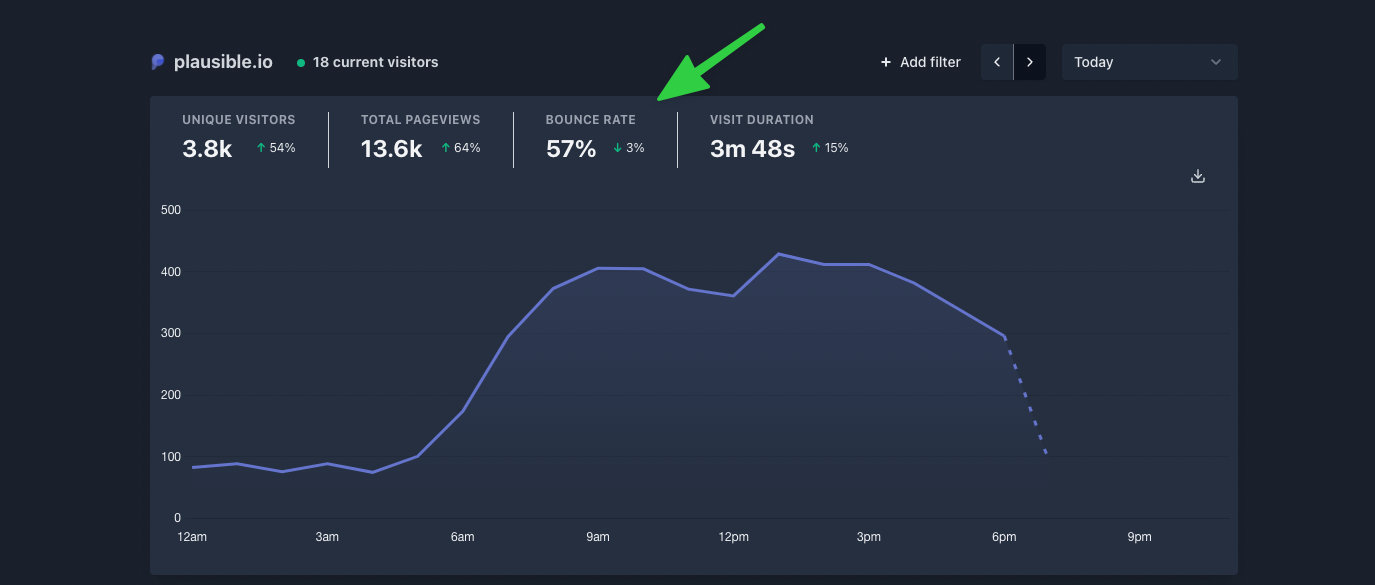
Bounce rate shows the percentage of visitors with a single page view — a visitor “bounces” away and leaves your site after only viewing a single page. Visit duration and time on page show you the amount of time visitors spend on your site consuming your content before they leave.
Say you have Google and Facebook each sending you 500 visitors per month. Without looking at other metrics, you may think they are equally useful sources of traffic. But if you add bounce rate and visit duration into the equation, you can then see a big difference in quality.
Google traffic bounce rate is at 43% and visit duration at 3 minutes. Facebook, on the other hand, brings lower quality traffic with a bounce rate of 86% and a visit duration of only 25 seconds.
It doesn’t necessarily mean that Facebook is a bad traffic source but it does show that things are not exactly what they seem on the surface. A closer look is needed to get more valuable insights, and that is exactly why understanding the basics of web analytics matters.
Are your visitors converting?
Goal conversions
Most web analytics tools allow site owners to set goals and events to track those visitor actions that matter the most to them. Examples of this can be anything from the number of visitors who subscribe to your newsletter, to things such as the number of trial sign-ups or the number of visitors who buy your product.
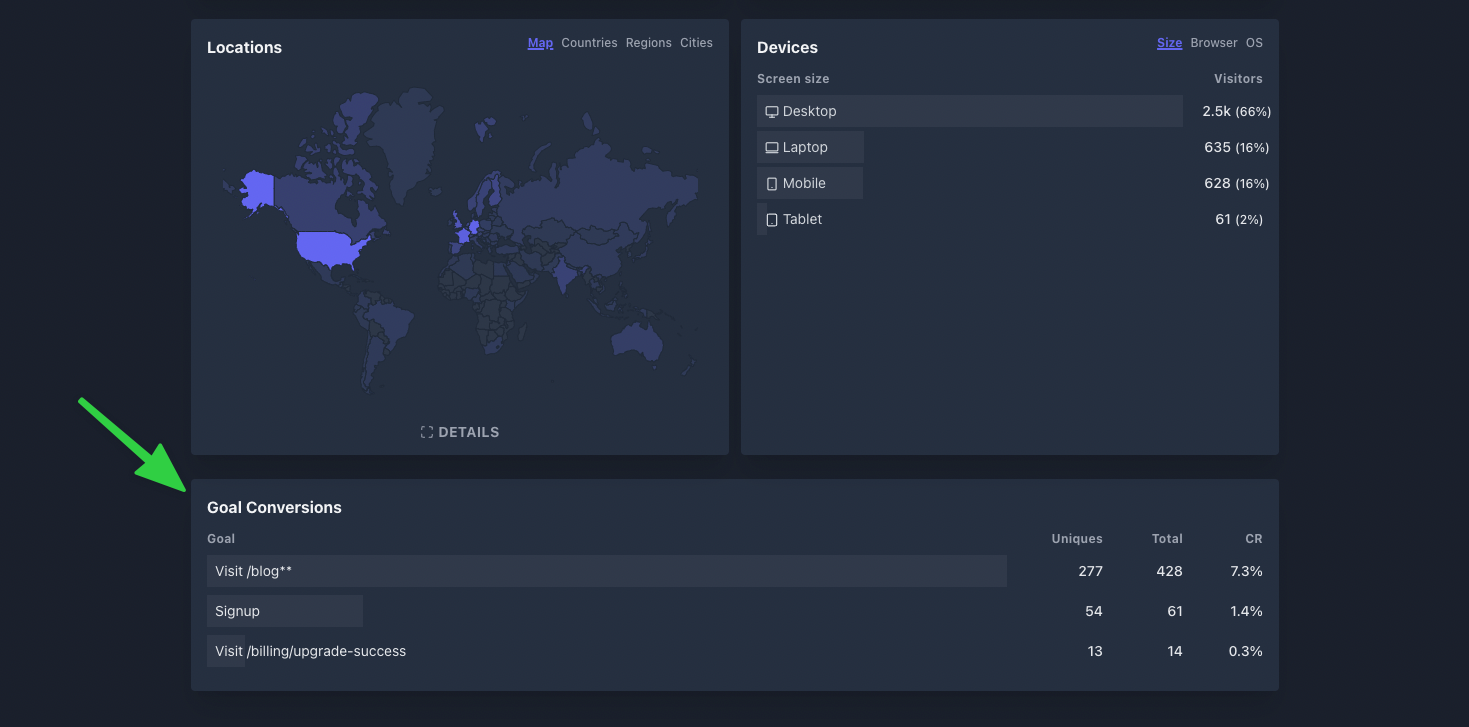
Goal conversions matter because they can be tied to referral sources and to the pages on your site that were visited during the session prior to the conversion. Therefore, you can know exactly where your best customers or subscribers are coming from and what actions they’re taking along the way — both of which are extremely powerful insights that should drive your strategy.
Say you ran two different paid advertising campaigns and spent $1,000 on each. Both returned a similar number of clicks. However, you tagged each individual campaign with its own unique UTM tag, which reveals one campaign brought in twice as many new subscriptions as the other.
Furthermore, by filtering your dashboard by the clicks from the individual UTM tags, you can get detailed insights into what actions people from the different paid campaigns took on your site the entire time they were there. This is the power of using goals and tags to evaluate your efforts.
Conclusion
Web analytics can be intimidating, especially for new creators and publishers. The key is to start small. Learn one metric at a time, and as you get more comfortable, continue building your knowledge and adding complexity to your experiments. Understanding these metrics is not a replacement for publishing great content, but they will help every piece you publish accomplish significantly more for your business.