Subscription business metrics explained for publishers
This user-friendly resource tells you everything you need to know about subscription business stats.
“If you don’t know your numbers, you don’t know your business.”
— Marcus Lemonis
The business of publishing has changed dramatically in the last century.
Newspapers, magazines, and books used to be the gold standard. Now, websites, blogs, and email newsletters have taken the industry reins and redefined what it means to be a successful publisher in the new economy.
One of the challenges writers must now face is navigating the business terms, metrics, and decisions that come along with creating a growing publication.
This resource will explain the most essential subscription business metrics every publisher needs to know. By the end of this article, you’ll have a clear understanding of how to measure the health of your business.
Acquisition, revenue, and retention
All the metrics covered in this article fit into one of three buckets: acquisition, revenue, or retention. Each bucket is concerned with a different part of your publishing business and will help you understand more about your customer’s journey.
Acquisition measures how many visitors turn into customers. The primary metric associated with this concept is conversion rate.
Revenue measures how much money is being generated by customers. The metrics related to this concept include monthly recurring revenue (MRR), annual recurring revenue (ARR), average revenue per user (ARPU), and lifetime value (LTV).
Retention measures how many customers stick around. One key metric that helps quantify this is churn rate.
Together, they present a holistic view of the health of your business.
Don’t worry if math isn't your favorite subject, you’ll find clear directions below, along with recommended tools that will help you every step of the way.
🎯 Acquisition
Let's take a deeper look at understanding how many of your website visitors turn into subscribers and customers.
Conversion rate
Conversion rate = # of conversions ÷ Total audience
Overview: Conversion rates help you identify how many people are taking the desired action within your subscription business. These actions generally include subscribing to an email list or purchasing an offer.
Why it matters: A business needs to convert strangers into customers in order to exist. This metric helps publishers measure how often this is happening and where there are opportunities for improvement.
High conversion rates likely correspond with a positive experience and clear alignment with the customer’s desire, while low ones may communicate an uninteresting value proposition or confusing customer journey.
Example: To help illustrate this concept, let’s use a sample publication named Newsletter A.
Last month, Newsletter A received 10,000 visitors to their website, 1,500 new email subscribers, and 50 new paying members.

Recommended tools: To understand conversion rate, you need to know how much traffic your website receives, as well as how many subscribers and customers you have attracted in the same time period. A good timeframe to measure your conversion rates is monthly.
For website traffic analytics, set up some form of analytics on your website using a tool like Google Analytics or Plausible.

Next, find out how many new subscribers and customers you receive each month. You can find this information in the Ghost and Stripe dashboards.
Since you're going to be using multiple tools to gather this information, one trick we like to use for measuring convsation rates is to plug this information into a simple Google Sheet and allow it to calculate the conversion rates for you automatically. This is also a great way to measure results over time, so you can see monthly and yearly trends.
💰 Revenue
Once you're happily converting visitors into customers, it's time to get a better sense of the financial health of your business. We recommend integrating with ChartMogul to make sense of the following metrics, though you can also see most of them inside your Stripe reports — it's a matter of preference.
Monthly recurring revenue (MRR)
MRR = # of subscribers x Cost of monthly subscription
Overview: MRR is a normalized calculation of how much money your subscription business brings in every month, taking all products and prices into account.
Why it matters: Selling subscriptions is a sustainable business model and a predictable source of income because it's recurring. If you've built a great product, your revenue keeps returning each month.
MRR is one of the most important metrics subscription businesses use to track revenue trends. While you may be tempted to look at this data at a granular level (every day, or every hour 😅) it's important to remember that MRR trends over time are the most important things to understand when making business decisions like changing your pricing or running a campaign.
It's also worth remembering that most subscription businesses never see "hockey stick" MRR growth, like this:
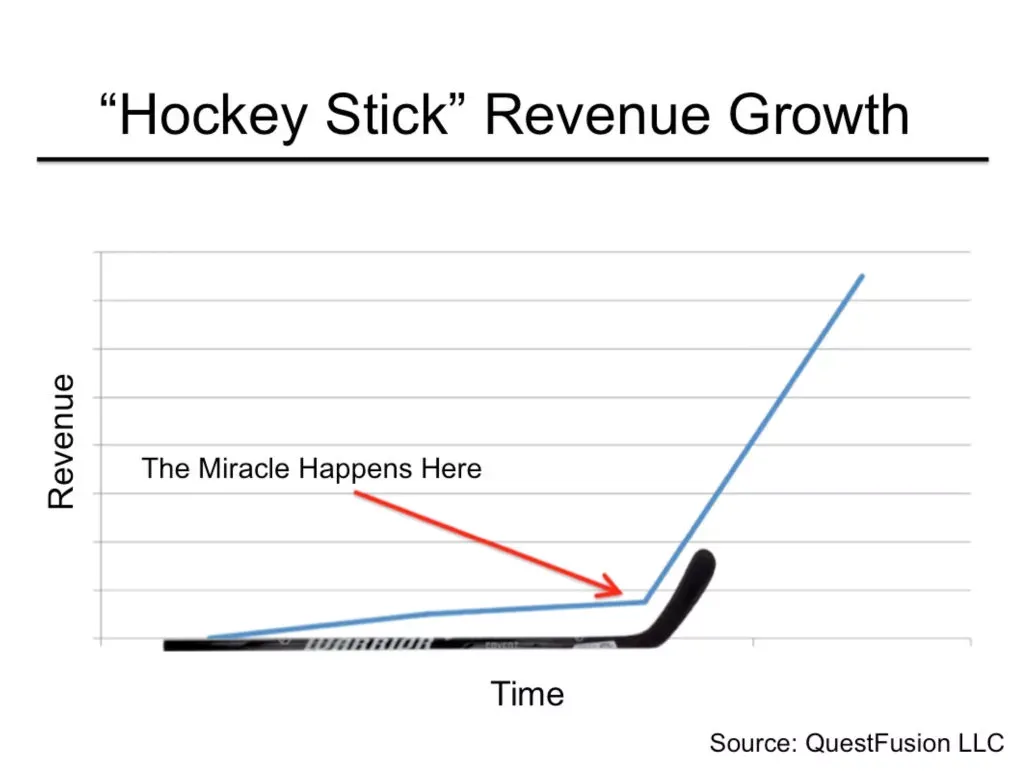
Most subscription businesses see slow-and-steady growth over a long period of time (linear, consistent, compounding growth is the rule, not the exception). Due to the sustainable nature of subscriptions, this can be a great way to run a business, especially if you're a solo publisher with minimal resources.
Example: Newsletter A has 800 paying members for their $12 per month product: 800 x $12 = $9,600 MRR.
Recommended tools: MRR is simple to calculate when there’s only one product at one price point as shown above. However, it can get a bit more complicated with multiple products.
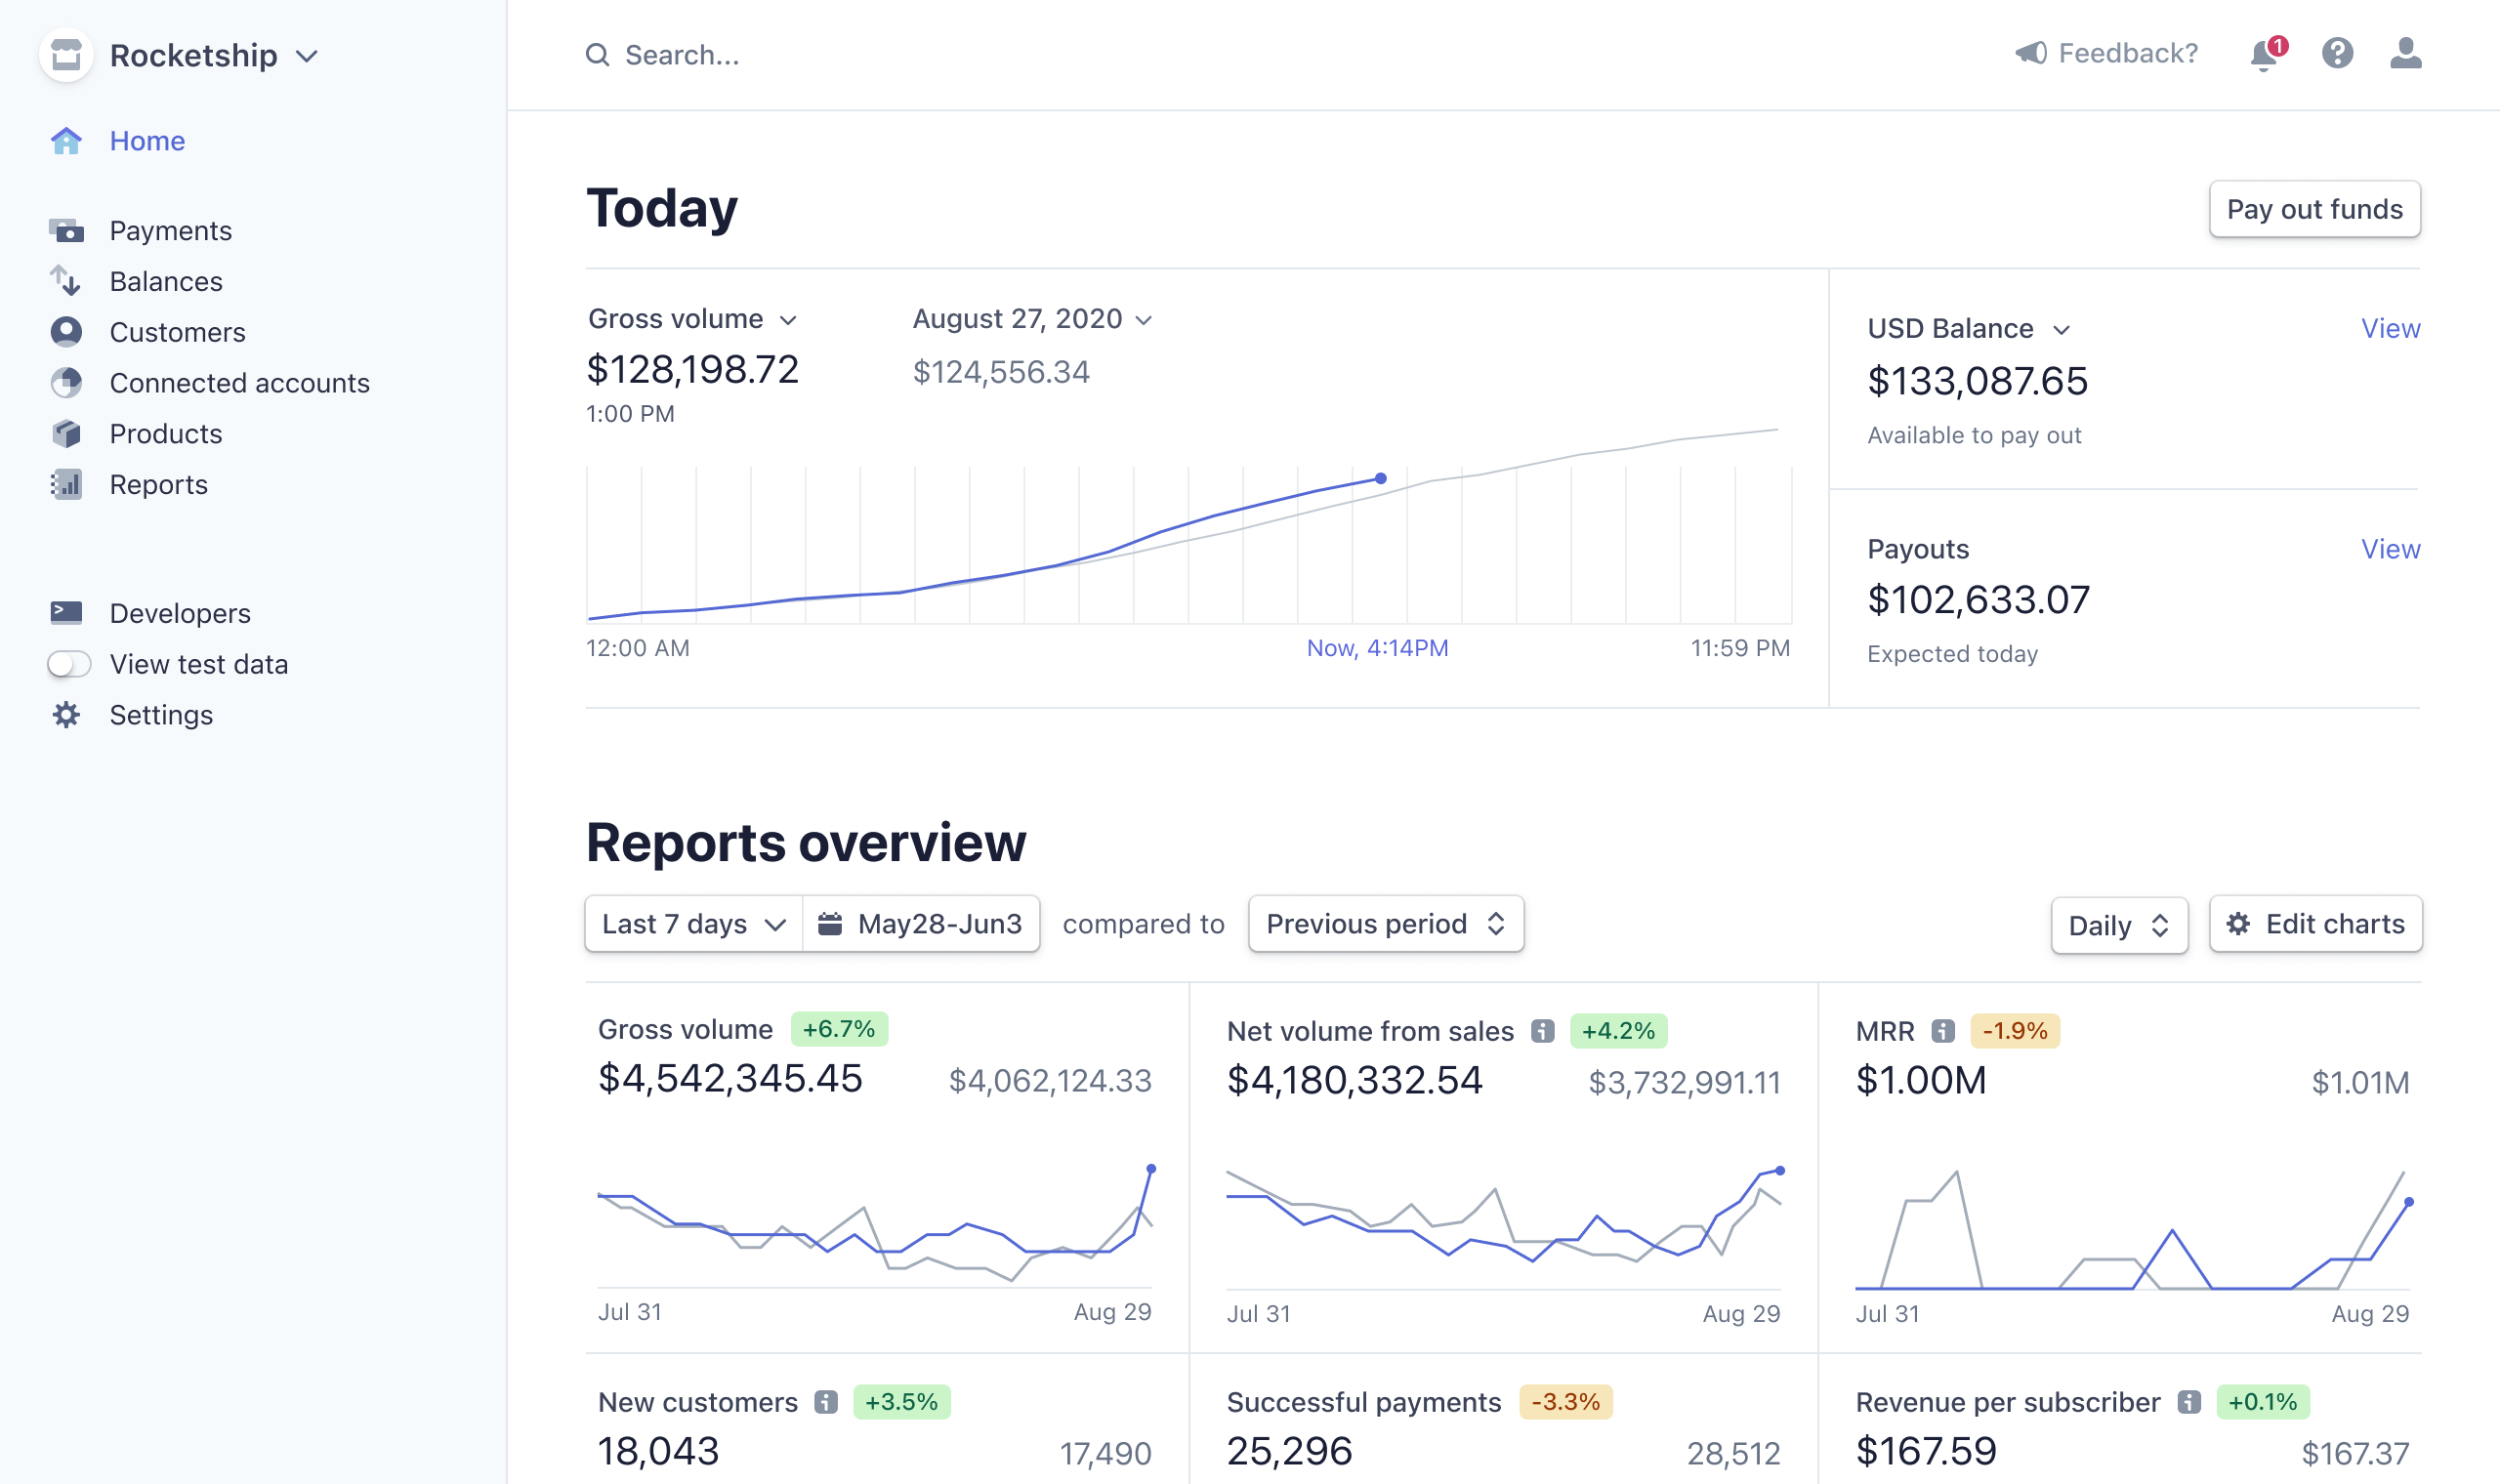
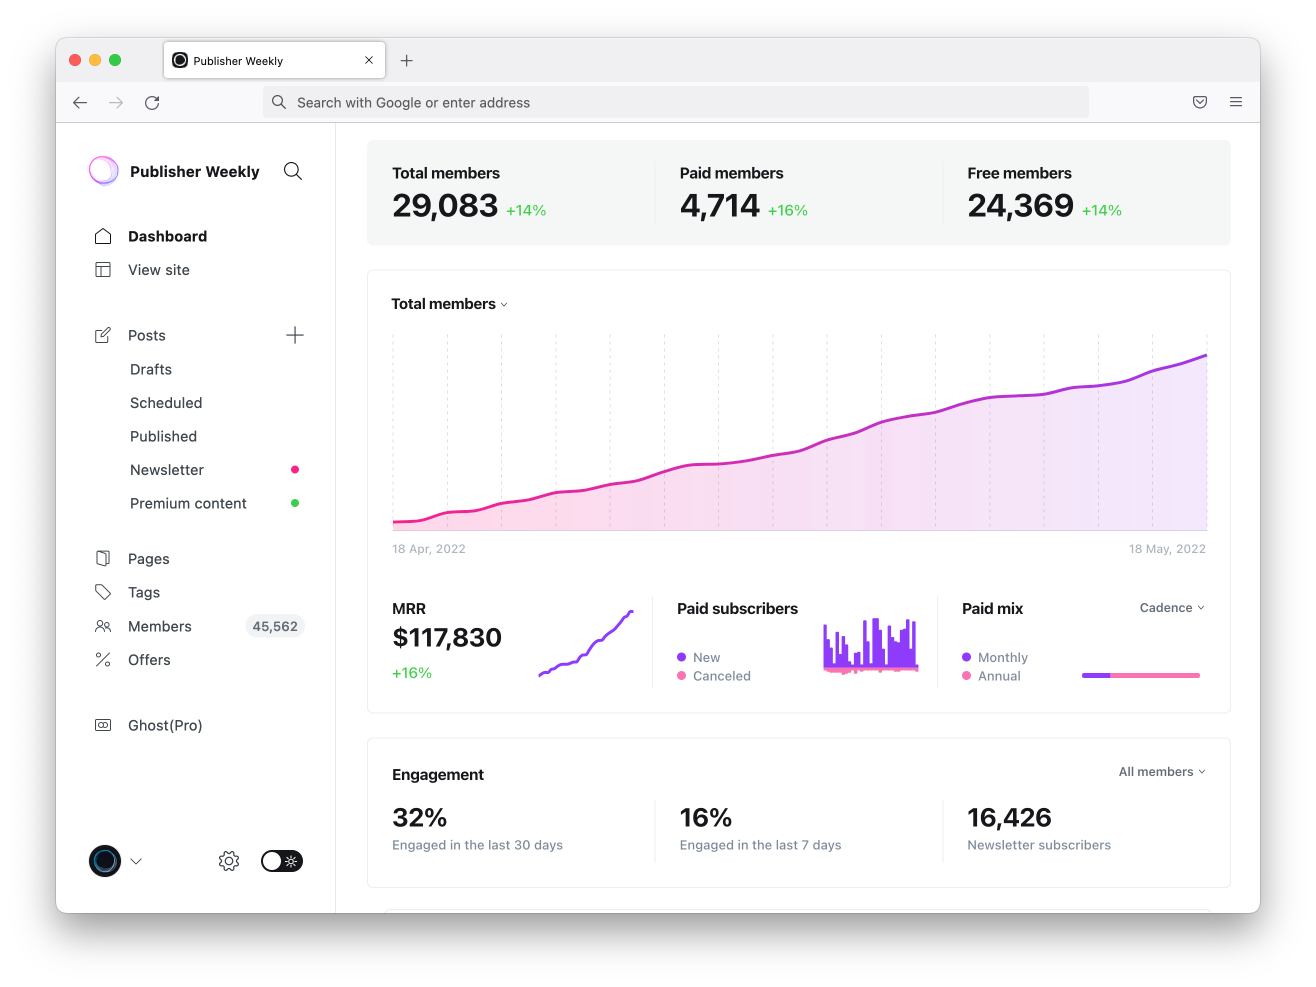
In Ghost, your MRR is reported directly in the dashboard, so you can see this figure each time you log in.
You can also view these metrics in your Stripe account (dashboard.stripe.com/billing) or consider integrating with ChartMogul, which is free for small businesses.

The great thing about using tools like this is that they automatically factor in additional information such as different products, prices, churn rates (customers canceling) or upsells (customers upgrading) — so you have the most accurate MRR figures possible.
Annual Recurring Revenue (ARR)
ARR = MRR x 12
Overview: Annual recurring revenue calculates how much money you can expect to generate from your subscriptions over a 12-month period.
Why it matters: When using a subscription business model, ARR is one of the key indicators of the financial health of your business, alongside its sister metric, MRR.
Sometimes also known as Annual Run Rate, ARR projects the future revenue for a full year based on the current monthly revenue figures. It's a useful metric to review over time, alongside MRR, to help predict the long-term growth of your business.
Example: Let’s continue with the figures used in MRR for Newsletter A. If it collects $9,600 per month, then: $9,600 x 12 = $115,200 ARR
Recommended tools: ChartMogul is the best tool to use for ARR reporting, or if you prefer you can use the free metrics report template.
Average revenue per user (ARPU)
ARPU = MRR ÷ Total # of customers
Overview: The average revenue per user measures how much money each individual customer brings to your business on average, typically on a monthly timeframe.
Why it matters: As your publishing business begins to offer more products (e.g., membership tiers, one-off events, or upsells), ARPU can clarify what offerings, pricing models, and types of customers are the best fit.
ARPU should increase over time as your marketing gets more targeted and your products provide higher levels of value to the right people.
Example: Newsletter B is a mature publication with multiple products and a steady subscriber base.
Here’s what the ARPU metric could look for them if they have $25,000 MRR and 1,250 active customers: $25,000 ÷ 1,250 = $20 ARPU
Recommended tools: ARPU can be viewed in your Stripe dashboard, or using ChartMogul.
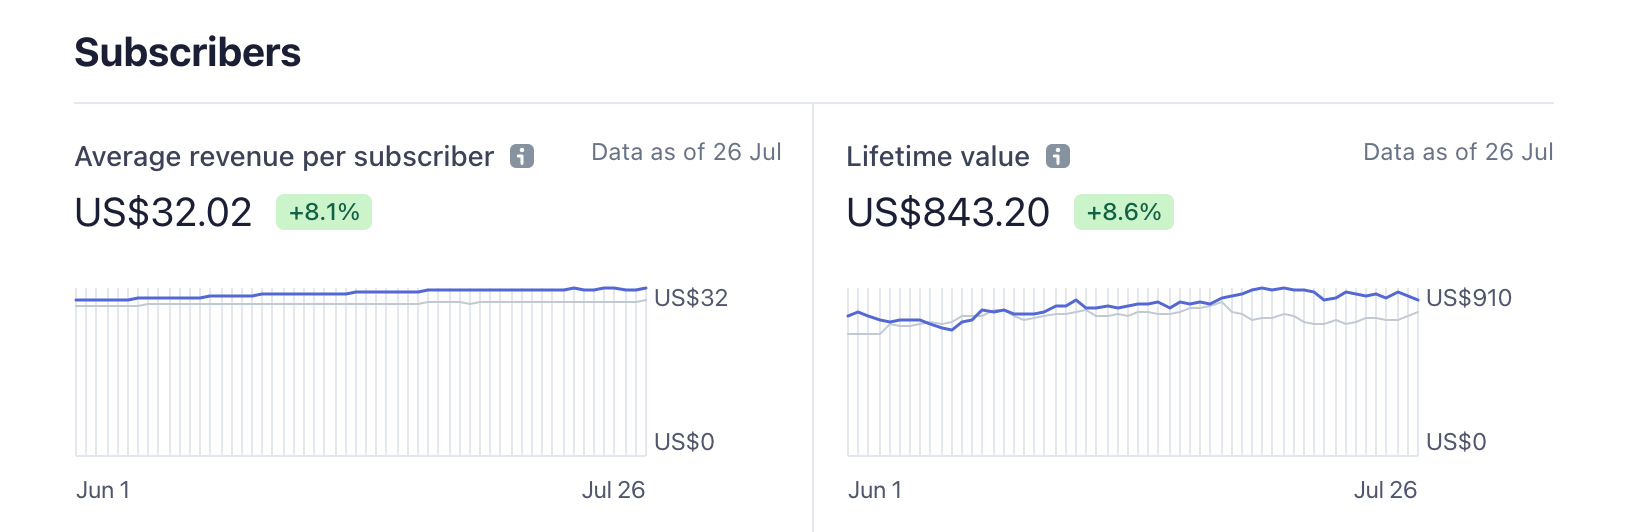
Lifetime value (LTV)
LTV = ARPU ÷ Churn rate
Overview: LTV offers publishers a way to quantify the total amount of money each customer is worth to your business over time.
Why it matters: Lifetime value is one metric, in particular, that speaks to the power of subscription-based businesses. Memberships thrive on longevity. The longer a customer stays, the better value they get and the more revenue the business receives.
Example: To calculate LTV, you’ll need the ARPU metric as well as the churn rate. If we use the Newsletter B example once more with an ARPU of $20 and invent a churn rate of 4%, our formula will look like this: $20 ÷ 4% = $500 LTV
This means, on average, each customer that begins a relationship with your business will generate $500 in total revenue.
Recommended tools: LTV can be viewed in your Stripe dashboard, or using ChartMogul.
🤝 Retention
Once running a subscription business, you quickly discover that retention becomes a priority, because it's more efficient to keep existing customers than it is to find new ones (of course, growth is still important).
Focusing on retention is a great opportunity to refine your product by consistently delivering value in order to keep your churn rates down.
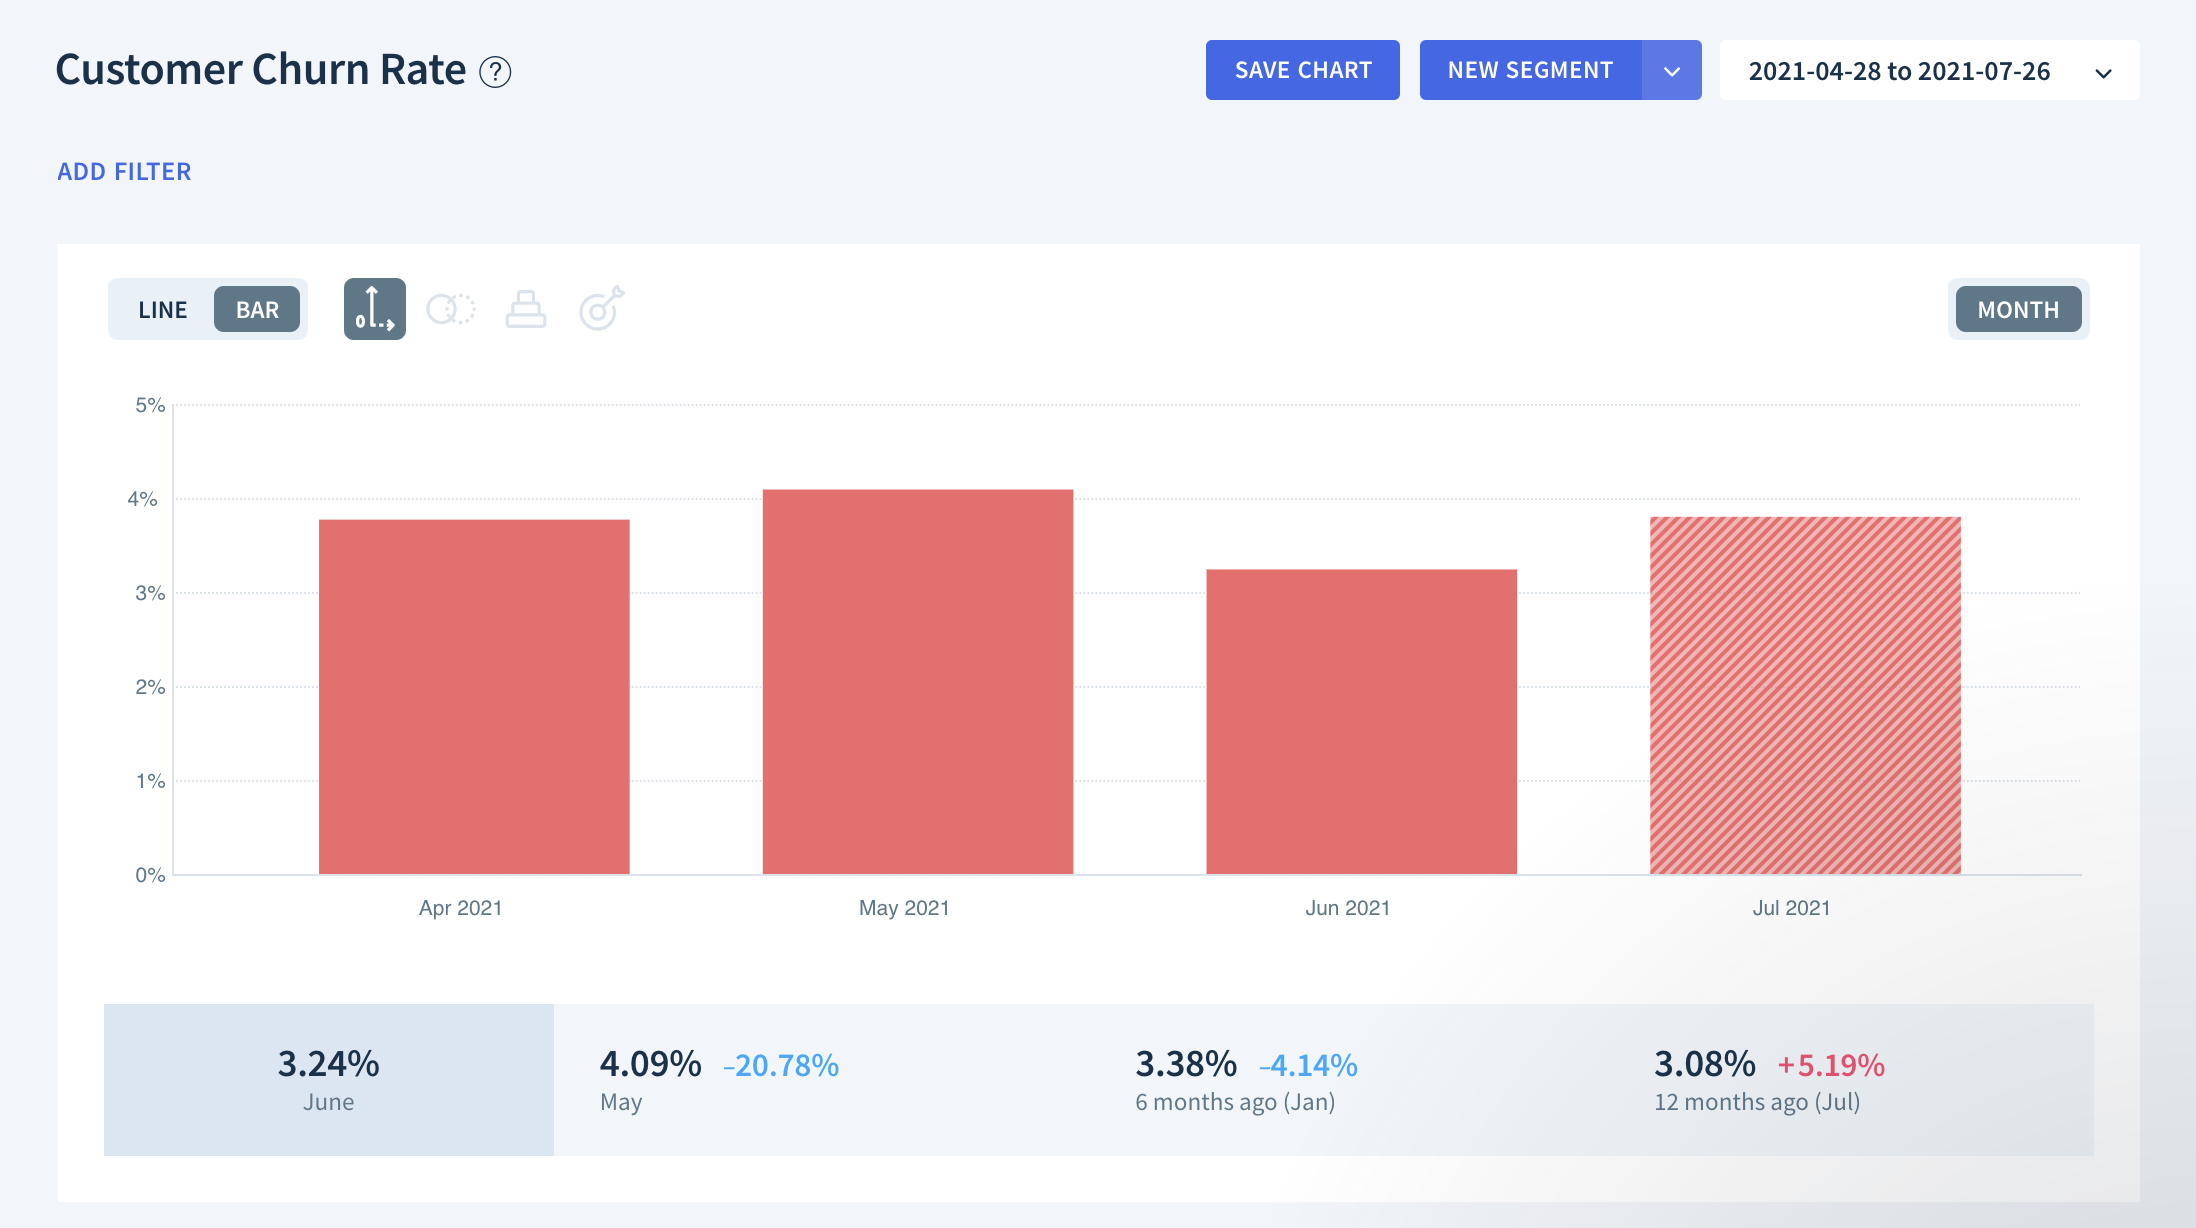
Churn rate
Churn rate = # of customers who left (during period of time) ÷ total # of customers
Overview: Churn reveals the percentage of people who stop being customers, whether by unsubscribing or canceling their product. Churn is the opposite, or inverse, of retention.
Why it matters: Although churn is a natural part of the customer lifecycle, your goal should be to keep this number low to improve long-term revenue. As seen above, churn directly impacts the LTV of your publishing business.
The best way to keep your churn rates to a minimum is by consistently producing the best content possible. You can also ask for cancellation feedback so that you can identify and resolve any roadblocks which may be leading to churn.
Higher periods of growth can result in an increase in churn. For example, running a promotional offer can cause this to happen. Looking at churn can help you to determine whether the promotion was worth it, or whether it attracted the right type of customers.
Example: Let’s use Newsletter B one final time. During a month-long period, 400 customers left from a total customer base (at the start of the period) of 10,000. The most straightforward calculation would look like this.

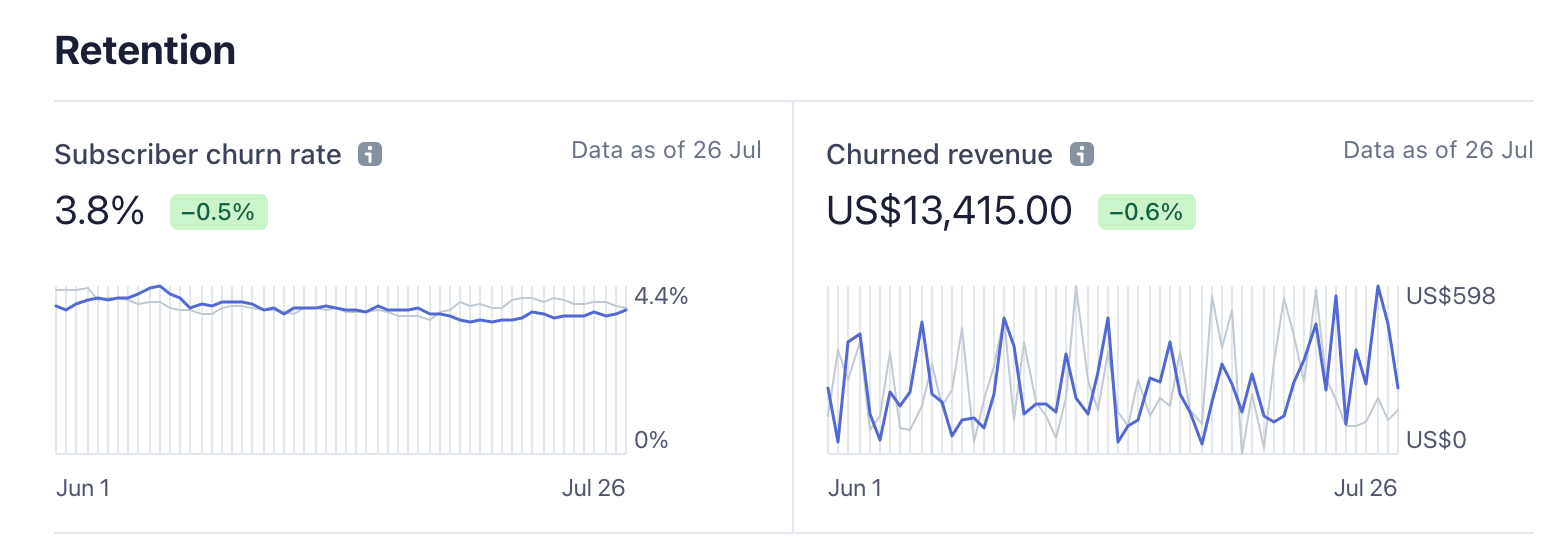
Recommended tools: ChartMogul is a great way to review reliable churn metrics for your business, and you can also see this information in your Stripe dashboard.
What's measured improves
Whether you have a list of 20,000 paying members or have just gotten your first subscriber, tracking these metrics will ensure that you’re heading in the right direction.
All of the metrics you need to run a growing publishing business can be captured using just two tools, Plausible and ChartMogul, both of which work seamlessly with Ghost and provide free or cost-effective plans for new users.
Numbers don't lie, and the publishers who pay attention to them will win.